~4 minute read
Successful campaigns depend on increasingly personalized marketing efforts. Modern marketing teams need an in-depth understanding of their customers – or potential customers – to build and execute campaigns that deliver effective results. Marketers must rely on accurate and detailed data to inform their efforts from the planning stages to execution and analysis if they want to meet their goals and drive business results.
To plan effective campaigns, marketing teams need to pull data on everything from the performance of past campaigns to customer demographics and psychographics, known buying behaviors, and more. They may even pull in third-party data such as competitor research or market trends to help inform their campaign planning. They can then explore and analyze this data to understand trends, view patterns and anomalies, and understand how to best market to their ideal customers.

Business users need to pull data from various sources so it can be analyzed for business growth.
Gathering all the relevant data and creating a single source of truth from which to analyze that data can be a real challenge. This often involves manually importing a wide range of metrics and data points into a tool like Excel. This process can be both time-consuming and resource intensive, and may result in input errors and missed data.
While marketers need comprehensive data from various sources – CRM tools, websites, Google Analytics, and more – they also need the means to explore and analyze that data more easily. Without the right tools and support, employees can’t accurately track the information they need about potential customers or see how that data may be related to or influenced by other key indicators. This makes it challenging to plan a personalized and data-informed marketing campaign that is likely to drive the desired results.
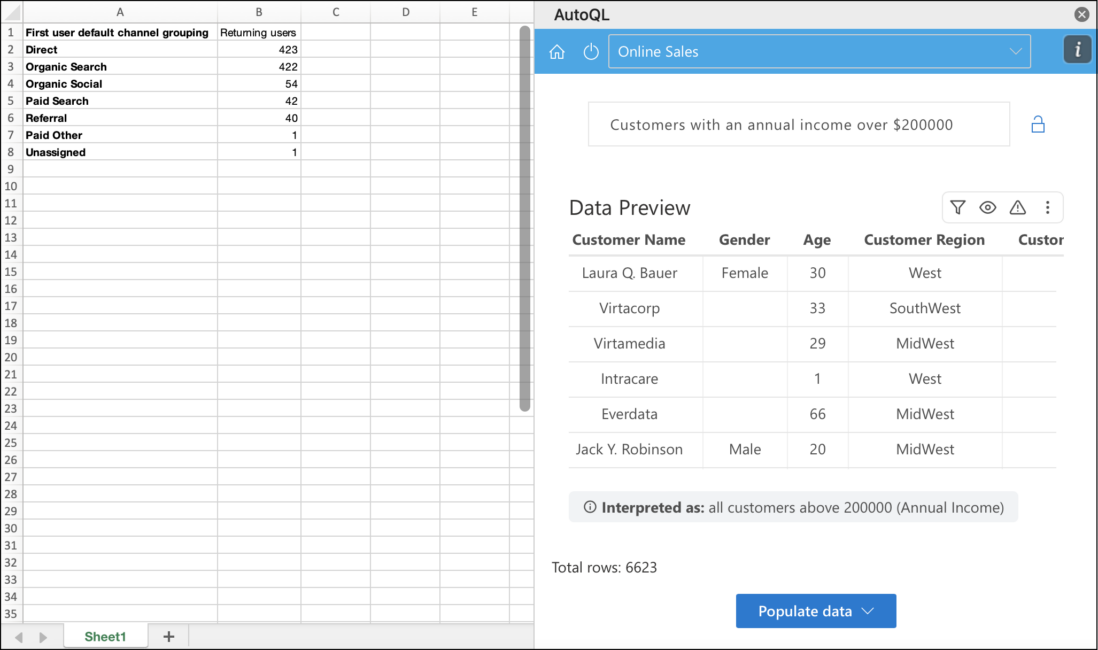
The AutoQL Add-in for Microsoft Excel enables groups like the marketing department to self-service their data needs. The Add-In allows them to quickly and effortlessly import their data in real-time, so they can more effectively plan, monitor, and analyze their campaigns. Data can be imported from multiple data sources and populated into different tabs so that all relevant information is available in one place.
 With the AutoQL Add-in for Excel, it’s easy for users to explore underlying data and discover unique insights and make more impactful decisions that drive growth and success.
For example, a marketing team may be planning to create a campaign targeted at a specific customer segment. Their objective is to drive conversions by delivering relevant content to this segment via a multi-pronged approach that includes ads, email marketing, and social media posts. By bringing existing data in from their CRM or analytics software, they can explore and understand who they should target, how they can best reach them, and where.
They could pull data from previous ad and email campaigns to analyze the number of impressions, costs per campaign, email open rates, click-through rates, and deals or purchases completed in a specific time frame, all from one Excel document. Once business users import their data using the AutoQL Add-in, they can leverage easy-to-use Excel features to interpret and analyze their data. This ability allows them to see the bigger picture and analyze campaigns end-to-end, rather than looking at one or two summary metrics that may otherwise be available in a generic dashboard or report.
While marketers may oversee the creation and execution of a particular campaign, they are not the only stakeholders invested in the data those efforts generate. Finance teams may approve ad spending budgets, while sales teams may be on the receiving end of incoming leads the campaign generated. Therefore, summaries of applicable data must be accessible to leadership teams and other departments to promote insight-sharing and ensure alignment across business units.
With features like the Quick Analysis Tool in Excel, marketers can easily create impactful visualizations to share with others. This helps them tell the story of that data to their managers or key stakeholders in other departments.
Instead of making decisions about campaigns based on instinct or incomplete data sets, marketers can quickly and accurately pull important information into one Excel document for analysis. Now, marketing teams can query multiple data sources in detail and seamlessly bring that data into Excel to further explore it through pre-built models or predictive tools. Access to relevant information is critical for creating successful campaign targeting and appealing to specific customer segments.