Topics

See How Chata.ai Helps Teams Act Faster
See How Chata.ai Helps Teams Act Faster
KPI Reporting with AI Tools: How to Get the Metrics That Matter in Time

Published
12 min read
Topics:
Self-Service Analytics

Table of Contents
Your business generates data every second. Yet most teams still wait days (sometimes weeks) for the metrics that are supposed to drive their decisions. The problem isn't a lack of data. It's a broken delivery chain: business users need metrics, analysts build reports, requests pile up, and by the time a KPI lands in someone's inbox, the window to act on it has already closed.
In this guide, we'll break down what AI-powered KPI reporting actually looks like in practice, how to evaluate tools before you commit, and what the workflow looks like when it's working as it should.
Key Takeaways
Data professionals spend an average of 44% of their time on data preparation and manual reporting rather than analysis (Anaconda, State of Data Science Report)
KPI reporting with AI tools like Chata.ai differs from traditional dashboards in a fundamental way: it tracks KPIs automatically and notifies business users directly — and it's accessible to every person to set up in minutes
Deterministic AI engines return the same trusted answer to the same question every time — critical for financial and operational KPIs
Automated alerts flip reporting from reactive (you discover changes after they happen) to proactive (you discover changes immediately as they happen)
Evaluation should prioritize reliability, accessibility, explainability, timeliness, and actionability
How KPI Reporting with AI Works and How Is It Different from a Dashboard?
Most teams assume their dashboard is their KPI reporting system. It isn't.
A dashboard is a destination. It sits there, waiting for someone to open it, navigate to the right view, apply the right filters, and interpret what they see. The insight is technically available — but only to the person who knows where to look, when to look, and what they're looking for. That's a high bar in a fast-moving business.
AI-powered KPI reporting flips this model. Instead of requiring your team to pull data, it pushes the right metrics to the right people at the right time. It monitors your KPIs continuously, recognizes when something meaningful has changed, and surfaces that information automatically — as a scheduled report, a real-time alert, or a plain-language summary delivered through the tools your team already uses.
The practical differences are significant. Traditional dashboards show you a snapshot; AI reporting delivers a signal. Dashboards require someone to identify the anomaly; AI reporting flags it before anyone notices. Dashboards answer the questions you remember to ask; AI reporting answers the questions you didn't know to ask yet.
There's also a significant access gap with dashboards. In most organizations, only analysts and power users can build or modify dashboards, which means every business user with a new KPI need has to join a queue. AI-powered KPI reporting — when built correctly — is self-serve from day one. Business users configure their own report schedules, set their own alert thresholds, and receive insights without waiting on a data team.
According to a 2023 Gartner report, organizations that shift from reactive to proactive analytics reduce time-to-insight by up to 60%. The move from dashboards to automated KPI reporting isn't an upgrade to your tooling — it's a structural shift in how your business relates to its own data.
KPI Reporting Shouldn't Require You to Show Up
Here's the uncomfortable truth about most reporting workflows: they only produce insights when someone actively drives them. An analyst builds the report. A manager requests the update. Someone remembers to check the dashboard on Friday before the weekend closes. The entire system runs on human initiation — which means it runs at human speed, subject to human availability, and prone to human gaps.
KPI reporting should work the way a good CFO thinks about their numbers: constantly, automatically, and with immediate escalation when something changes. If revenue drops 15% in a single day, the right person should know about it that day — not at the next weekly review, and certainly not when someone happens to pull a report.
The shift to proactive KPI reporting means the monitoring never stops. AI workers run 24/7, scanning your connected data sources against the conditions you've defined. When a KPI crosses a threshold, moves outside a historical range, or hits a milestone — an alert fires. No one has to remember to check. No one has to build a new report. The system delivers the insight the moment it becomes relevant.
This is how reporting moves from a cost center to a competitive advantage. Teams that receive KPI updates in real time make decisions in real time. Teams still waiting for Monday's report are always one week behind.
How to Evaluate AI Tools for KPI Reporting (A Practical Checklist)
Not all AI reporting tools are built the same. Before committing to a platform, it's worth asking the right questions — because the differences that matter most aren't always visible in a demo.
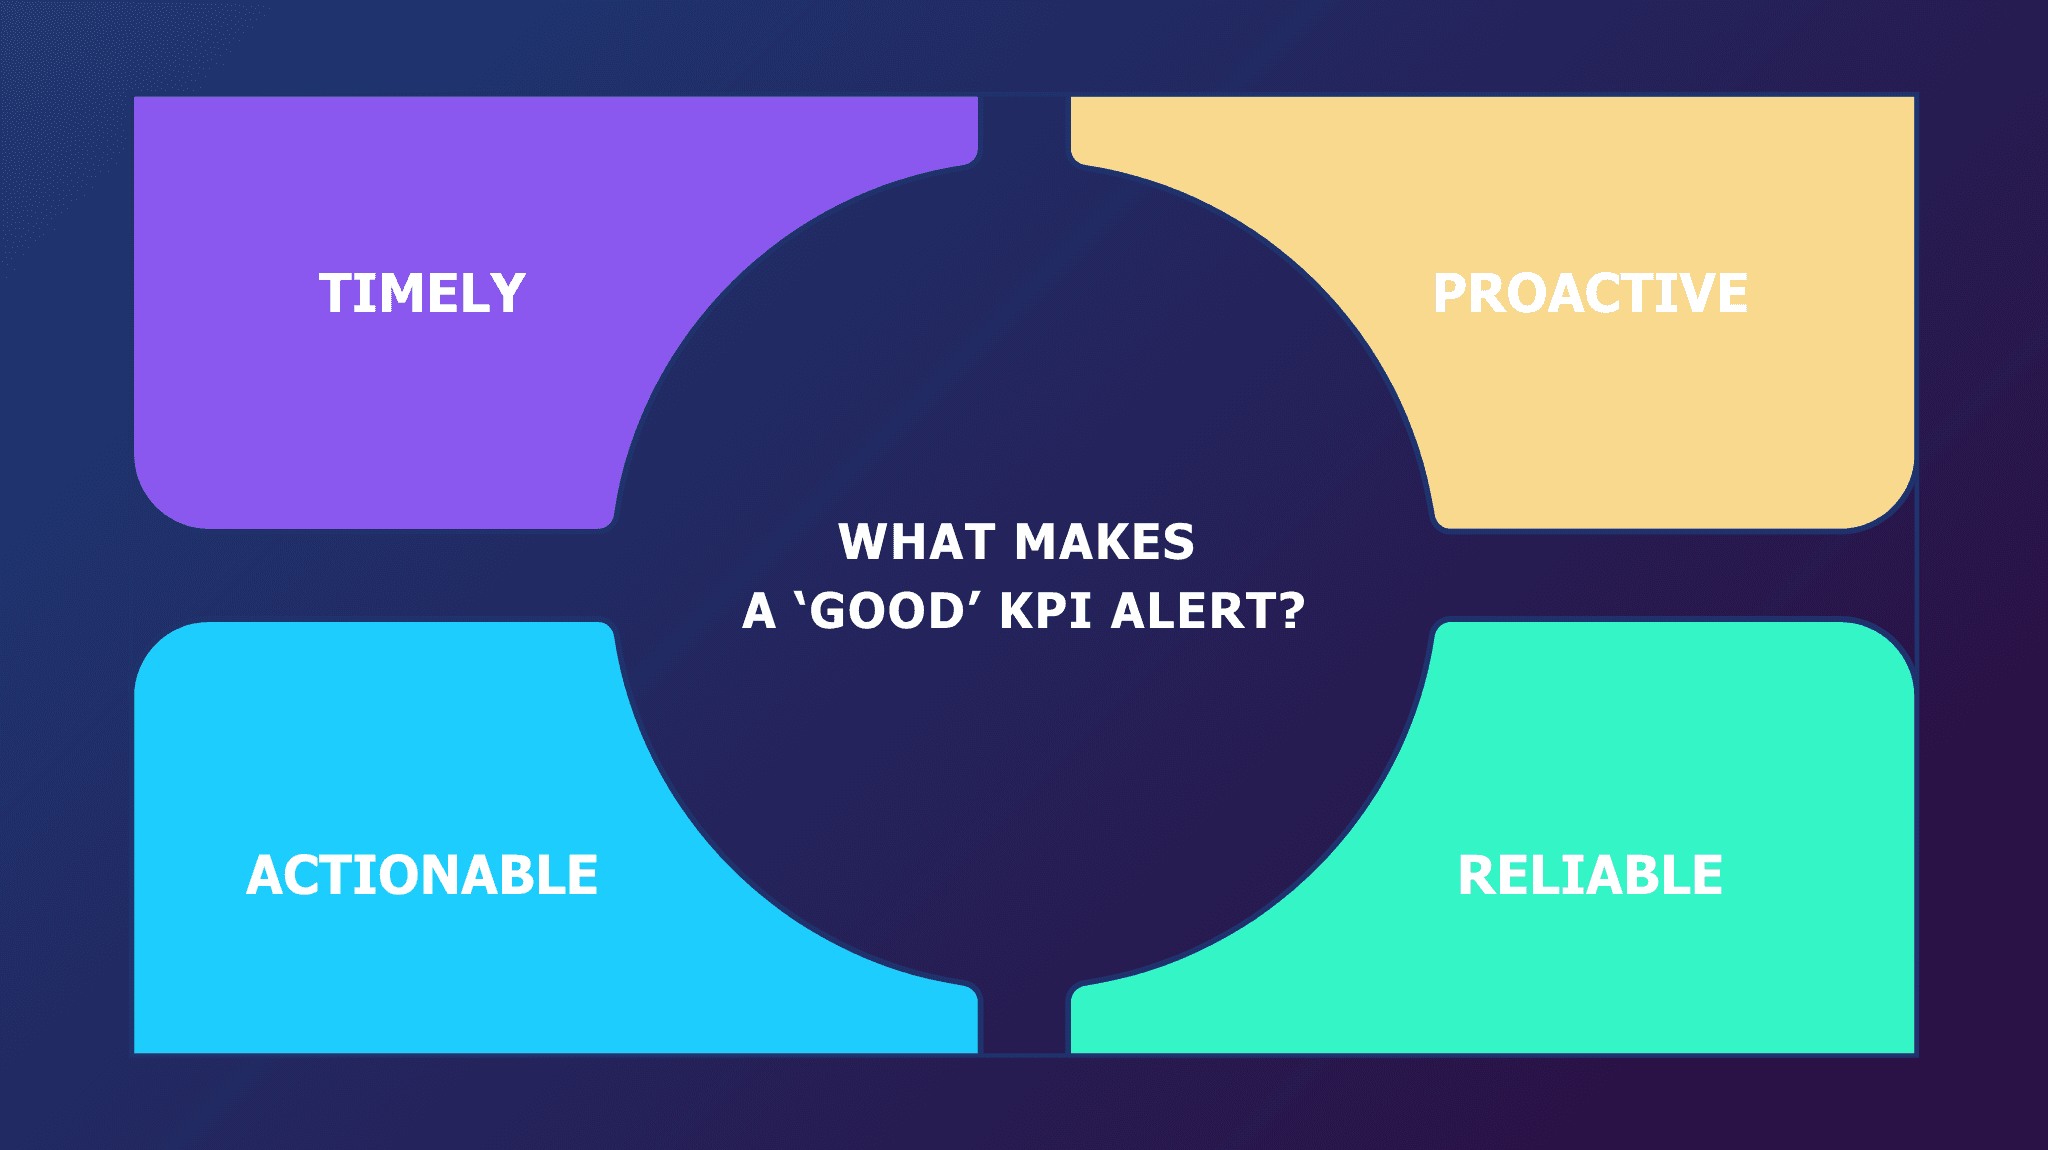
A good KPI alert — and by extension, a good KPI reporting platform — should be four things: Timely, Proactive, Actionable, and Reliable. Use these as your anchor criteria when assessing any tool.
The Questions Worth Asking
✔️ Can it automate report delivery with built-in analysis?
Scheduled delivery is table stakes. What matters is whether the report arrives with context — not just numbers, but an explanation of what changed and why it matters. Look for platforms that generate plain-language summaries alongside the data, so recipients can act without additional interpretation.
✔️ How does it provide real-time monitoring and alerting?
Find out what's actually happening under the hood. Is the platform polling data on a fixed schedule, or is it monitoring continuously? Can you configure alert conditions in plain language without SQL? Does it send alerts only when conditions are truly met, or does it generate noise? For operational KPIs, the difference between a 15-minute delay and a real-time alert is often the difference between catching an issue and cleaning up after it.
✔️ Is the underlying data governed and consistent?
Reliable KPI reporting depends on reliable data. Ask whether the platform enforces a semantic layer — a central set of metric definitions, join paths, and business logic that ensures every report and alert uses the same numbers. Without it, you'll have different answers depending on who runs the query. For regulated industries, also ask about role-based access controls: every person should only ever see the data they're permitted to see.
✔️ Can business users configure it without data team involvement?
If setup and maintenance require an analyst or developer, you've shifted the bottleneck rather than removed it. The right platform is self-serve from day one — business users should be able to connect data, configure schedules, define KPIs, and set alert thresholds in plain language, without writing code or raising a ticket.
✔️ Does it integrate with how your team already works?
Adoption is the silent killer of every analytics initiative. Look for platforms that deliver insights where work already happens — Slack, Microsoft Teams, email — rather than requiring users to log into yet another interface. Also consider whether the platform can be embedded into existing internal apps via API, which is particularly valuable for enterprises that want to surface analytics within their own product experience.
How Chata.ai Gets You the Right Metrics at the Right Time
Most AI analytics tools make you ask for your KPIs. Chata.ai delivers them automatically — with alerts, reports, and insights before you think to look.
Chata.ai is built on AutoQL — a proprietary deterministic AI engine trained on your schemas, joins, and governed business logic. AutoQL acts as a precision semantic layer: translating questions into validated, consistent queries that follow your approved metrics, structures, and access controls. The result is 100% consistent, query-based responses that can work independently or be called directly by generative AI models and agentic workflows.
Because AutoQL is deterministic — it doesn't infer, estimate, or hallucinate. The same question returns the same answer every time, grounded in your actual data. For financial and operational KPIs, that consistency isn't a nice-to-have. It's non-negotiable.
On top of this engine, Chata.ai's AI workers monitor your data 24/7, automatically surfacing KPI changes and anomalies without anyone having to log in or ask. Here's how that plays out in practice.

Automated Reporting & Analysis
Manual reporting has a hidden cost that most teams never fully account for. It's not just the hours spent pulling data — it's the delay between when something changes and when anyone finds out. By the time a report is built, formatted, and distributed, the insight is already stale.
Chata.ai's automated reporting replaces this cycle entirely. Business users define the queries they want to track in plain language — "What is weekly revenue by region for the last month?" — and configure when those reports should run and where they should be delivered. From that point, the system handles everything. Reports go out on schedule, via email, Slack, or Microsoft Teams, with built-in analysis that highlights what changed and what it means.
No SQL. No manual data pulls. No rebuilding the same summary tab every Monday morning. The setup takes minutes, and it's fully owned by the business user — no data team required. Reports are secured by role-based access controls, fully auditable with a transparent audit trail, and generated using deterministic logic — so every stakeholder receives numbers they can trust.
For teams that produce high-frequency reports — weekly revenue snapshots, daily pipeline summaries, monthly board packs — this shift from manual to automated isn't incremental. It's the kind of structural change that recovers hours every week and ensures insights are always current.
Automated Insights from Real-Time Alerts
Scheduled reports tell you what happened. Alerts tell you what's happening right now, the moment it matters.
Chata.ai's automated insights engine continuously scans your connected data sources, detecting KPI shifts, anomalies, and threshold breaches as they occur — and sending notifications before anyone has to look. These aren't generic triggers. Every alert is generated by the same deterministic AI engine that powers the rest of the platform, which means they're grounded in your actual business logic and free of false positives.
When an alert fires, it arrives with immediate context: what changed, by how much, and why it matters. Business users can then follow up in plain language — asking "Why did this happen?" directly within the Chata.ai interface — and receive answers from live data without routing the question through a data team.
This is what separates proactive analytics from passive reporting. The system doesn't wait for you to notice a problem. It identifies the signal, delivers the context, and enables the decision — all within a single workflow.
Business users can also create and subscribe to the specific KPI alerts they care about in minutes, without engineering support. That reduces ad hoc data requests, accelerates decision-making, and keeps every team informed without adding to analyst workload.
Built for Regulated Enterprises
Because AutoQL is trained on your specific data model and enforces role-based and attribute-based access controls at the query level, every report and alert respects the permissions of the person receiving it. Answers are always permissioned. Audit trails are immutable.
Chata.ai is ISO 27001 certified and SOC 2 Type II certified — built for environments where data governance and compliance aren't optional. Whether you operate in financial services, logistics, or any other regulated industry, the platform ensures that KPI reporting never creates a data access risk.
Frequently Asked Questions
Can AI tools replace my BI team for KPI reporting?
No — and that's not the right framing. AI tools for KPI reporting are designed to eliminate the repetitive, low-value work that consumes analyst time: pulling data, formatting reports, fielding the same questions week after week. What they free up is the capacity for analysts to focus on deeper analysis, model building, and strategic work that actually requires human expertise. Think of AI KPI reporting tools as removing the queue, not the team. Your BI team stops spending 44% of their time on data prep (Anaconda) and starts spending more time on the work that moves the business forward.
How accurate is AI-generated KPI data compared to manual reports?
This depends almost entirely on the type of AI engine underlying the tool. Probabilistic AI — the kind used in most general-purpose large language models — generates answers by inference, which introduces the risk of hallucinations and inconsistencies. Deterministic AI, like the engine behind Chata.ai's AutoQL, operates differently: it applies defined logic to your governed data, which means the same query returns the same validated answer every time. For KPI reporting specifically, deterministic AI is the more reliable foundation — and in many cases, more accurate than manual reports, which are subject to human error, stale data, and inconsistent metric definitions across teams. Learn more about how deterministic AI works.
What's the difference between automated reporting and automated alerts in AI analytics?
Automated reporting delivers structured outputs — summaries, tables, charts — on a fixed schedule. Automated alerts, on the other hand, are trigger-based: the system monitors KPIs continuously and notifies users the moment a threshold is crossed or an anomaly is detected. The two work together — scheduled reporting keeps teams informed on a cadence, while alerts catch what can't wait for the next report.
Stop Waiting for Your KPIs — Make Them Come to You
The real question for any organization that depends on KPI reporting isn't whether their platform can answer questions. It's whether the platform is working when nobody's asking. Whether the anomaly on Thursday gets surfaced on Thursday. Whether the weekly report lands with built-in analysis and zero manual effort. Whether the team is spending time making decisions — not hunting for the numbers behind them.
That's the shift proactive analytics makes. And it's worth understanding before your next KPI arrives two days too late to act on.
Chata.ai is built to make that a reality: automated reports with built-in analysis, real-time KPI alerts, and a deterministic AI engine that ensures every insight you receive is accurate, governed, and permissioned — without any manual effort from your team.
Book a demo with Chata.ai and see what KPI reporting looks like when it works the way it should.
Topics
See How Chata.ai Helps Teams Act Faster
KPI Reporting with AI Tools: How to Get the Metrics That Matter in Time
Published
12 min read
Topics:
Self-Service Analytics
Table of Contents
Your business generates data every second. Yet most teams still wait days (sometimes weeks) for the metrics that are supposed to drive their decisions. The problem isn't a lack of data. It's a broken delivery chain: business users need metrics, analysts build reports, requests pile up, and by the time a KPI lands in someone's inbox, the window to act on it has already closed.
In this guide, we'll break down what AI-powered KPI reporting actually looks like in practice, how to evaluate tools before you commit, and what the workflow looks like when it's working as it should.
Key Takeaways
Data professionals spend an average of 44% of their time on data preparation and manual reporting rather than analysis (Anaconda, State of Data Science Report)
KPI reporting with AI tools like Chata.ai differs from traditional dashboards in a fundamental way: it tracks KPIs automatically and notifies business users directly — and it's accessible to every person to set up in minutes
Deterministic AI engines return the same trusted answer to the same question every time — critical for financial and operational KPIs
Automated alerts flip reporting from reactive (you discover changes after they happen) to proactive (you discover changes immediately as they happen)
Evaluation should prioritize reliability, accessibility, explainability, timeliness, and actionability
How KPI Reporting with AI Works and How Is It Different from a Dashboard?
Most teams assume their dashboard is their KPI reporting system. It isn't.
A dashboard is a destination. It sits there, waiting for someone to open it, navigate to the right view, apply the right filters, and interpret what they see. The insight is technically available — but only to the person who knows where to look, when to look, and what they're looking for. That's a high bar in a fast-moving business.
AI-powered KPI reporting flips this model. Instead of requiring your team to pull data, it pushes the right metrics to the right people at the right time. It monitors your KPIs continuously, recognizes when something meaningful has changed, and surfaces that information automatically — as a scheduled report, a real-time alert, or a plain-language summary delivered through the tools your team already uses.
The practical differences are significant. Traditional dashboards show you a snapshot; AI reporting delivers a signal. Dashboards require someone to identify the anomaly; AI reporting flags it before anyone notices. Dashboards answer the questions you remember to ask; AI reporting answers the questions you didn't know to ask yet.
There's also a significant access gap with dashboards. In most organizations, only analysts and power users can build or modify dashboards, which means every business user with a new KPI need has to join a queue. AI-powered KPI reporting — when built correctly — is self-serve from day one. Business users configure their own report schedules, set their own alert thresholds, and receive insights without waiting on a data team.
According to a 2023 Gartner report, organizations that shift from reactive to proactive analytics reduce time-to-insight by up to 60%. The move from dashboards to automated KPI reporting isn't an upgrade to your tooling — it's a structural shift in how your business relates to its own data.
KPI Reporting Shouldn't Require You to Show Up
Here's the uncomfortable truth about most reporting workflows: they only produce insights when someone actively drives them. An analyst builds the report. A manager requests the update. Someone remembers to check the dashboard on Friday before the weekend closes. The entire system runs on human initiation — which means it runs at human speed, subject to human availability, and prone to human gaps.
KPI reporting should work the way a good CFO thinks about their numbers: constantly, automatically, and with immediate escalation when something changes. If revenue drops 15% in a single day, the right person should know about it that day — not at the next weekly review, and certainly not when someone happens to pull a report.
The shift to proactive KPI reporting means the monitoring never stops. AI workers run 24/7, scanning your connected data sources against the conditions you've defined. When a KPI crosses a threshold, moves outside a historical range, or hits a milestone — an alert fires. No one has to remember to check. No one has to build a new report. The system delivers the insight the moment it becomes relevant.
This is how reporting moves from a cost center to a competitive advantage. Teams that receive KPI updates in real time make decisions in real time. Teams still waiting for Monday's report are always one week behind.
How to Evaluate AI Tools for KPI Reporting (A Practical Checklist)
Not all AI reporting tools are built the same. Before committing to a platform, it's worth asking the right questions — because the differences that matter most aren't always visible in a demo.
A good KPI alert — and by extension, a good KPI reporting platform — should be four things: Timely, Proactive, Actionable, and Reliable. Use these as your anchor criteria when assessing any tool.
The Questions Worth Asking
✔️ Can it automate report delivery with built-in analysis?
Scheduled delivery is table stakes. What matters is whether the report arrives with context — not just numbers, but an explanation of what changed and why it matters. Look for platforms that generate plain-language summaries alongside the data, so recipients can act without additional interpretation.
✔️ How does it provide real-time monitoring and alerting?
Find out what's actually happening under the hood. Is the platform polling data on a fixed schedule, or is it monitoring continuously? Can you configure alert conditions in plain language without SQL? Does it send alerts only when conditions are truly met, or does it generate noise? For operational KPIs, the difference between a 15-minute delay and a real-time alert is often the difference between catching an issue and cleaning up after it.
✔️ Is the underlying data governed and consistent?
Reliable KPI reporting depends on reliable data. Ask whether the platform enforces a semantic layer — a central set of metric definitions, join paths, and business logic that ensures every report and alert uses the same numbers. Without it, you'll have different answers depending on who runs the query. For regulated industries, also ask about role-based access controls: every person should only ever see the data they're permitted to see.
✔️ Can business users configure it without data team involvement?
If setup and maintenance require an analyst or developer, you've shifted the bottleneck rather than removed it. The right platform is self-serve from day one — business users should be able to connect data, configure schedules, define KPIs, and set alert thresholds in plain language, without writing code or raising a ticket.
✔️ Does it integrate with how your team already works?
Adoption is the silent killer of every analytics initiative. Look for platforms that deliver insights where work already happens — Slack, Microsoft Teams, email — rather than requiring users to log into yet another interface. Also consider whether the platform can be embedded into existing internal apps via API, which is particularly valuable for enterprises that want to surface analytics within their own product experience.
How Chata.ai Gets You the Right Metrics at the Right Time
Most AI analytics tools make you ask for your KPIs. Chata.ai delivers them automatically — with alerts, reports, and insights before you think to look.
Chata.ai is built on AutoQL — a proprietary deterministic AI engine trained on your schemas, joins, and governed business logic. AutoQL acts as a precision semantic layer: translating questions into validated, consistent queries that follow your approved metrics, structures, and access controls. The result is 100% consistent, query-based responses that can work independently or be called directly by generative AI models and agentic workflows.
Because AutoQL is deterministic — it doesn't infer, estimate, or hallucinate. The same question returns the same answer every time, grounded in your actual data. For financial and operational KPIs, that consistency isn't a nice-to-have. It's non-negotiable.
On top of this engine, Chata.ai's AI workers monitor your data 24/7, automatically surfacing KPI changes and anomalies without anyone having to log in or ask. Here's how that plays out in practice.
Automated Reporting & Analysis
Manual reporting has a hidden cost that most teams never fully account for. It's not just the hours spent pulling data — it's the delay between when something changes and when anyone finds out. By the time a report is built, formatted, and distributed, the insight is already stale.
Chata.ai's automated reporting replaces this cycle entirely. Business users define the queries they want to track in plain language — "What is weekly revenue by region for the last month?" — and configure when those reports should run and where they should be delivered. From that point, the system handles everything. Reports go out on schedule, via email, Slack, or Microsoft Teams, with built-in analysis that highlights what changed and what it means.
No SQL. No manual data pulls. No rebuilding the same summary tab every Monday morning. The setup takes minutes, and it's fully owned by the business user — no data team required. Reports are secured by role-based access controls, fully auditable with a transparent audit trail, and generated using deterministic logic — so every stakeholder receives numbers they can trust.
For teams that produce high-frequency reports — weekly revenue snapshots, daily pipeline summaries, monthly board packs — this shift from manual to automated isn't incremental. It's the kind of structural change that recovers hours every week and ensures insights are always current.
Automated Insights from Real-Time Alerts
Scheduled reports tell you what happened. Alerts tell you what's happening right now, the moment it matters.
Chata.ai's automated insights engine continuously scans your connected data sources, detecting KPI shifts, anomalies, and threshold breaches as they occur — and sending notifications before anyone has to look. These aren't generic triggers. Every alert is generated by the same deterministic AI engine that powers the rest of the platform, which means they're grounded in your actual business logic and free of false positives.
When an alert fires, it arrives with immediate context: what changed, by how much, and why it matters. Business users can then follow up in plain language — asking "Why did this happen?" directly within the Chata.ai interface — and receive answers from live data without routing the question through a data team.
This is what separates proactive analytics from passive reporting. The system doesn't wait for you to notice a problem. It identifies the signal, delivers the context, and enables the decision — all within a single workflow.
Business users can also create and subscribe to the specific KPI alerts they care about in minutes, without engineering support. That reduces ad hoc data requests, accelerates decision-making, and keeps every team informed without adding to analyst workload.
Built for Regulated Enterprises
Because AutoQL is trained on your specific data model and enforces role-based and attribute-based access controls at the query level, every report and alert respects the permissions of the person receiving it. Answers are always permissioned. Audit trails are immutable.
Chata.ai is ISO 27001 certified and SOC 2 Type II certified — built for environments where data governance and compliance aren't optional. Whether you operate in financial services, logistics, or any other regulated industry, the platform ensures that KPI reporting never creates a data access risk.
Frequently Asked Questions
Can AI tools replace my BI team for KPI reporting?
No — and that's not the right framing. AI tools for KPI reporting are designed to eliminate the repetitive, low-value work that consumes analyst time: pulling data, formatting reports, fielding the same questions week after week. What they free up is the capacity for analysts to focus on deeper analysis, model building, and strategic work that actually requires human expertise. Think of AI KPI reporting tools as removing the queue, not the team. Your BI team stops spending 44% of their time on data prep (Anaconda) and starts spending more time on the work that moves the business forward.
How accurate is AI-generated KPI data compared to manual reports?
This depends almost entirely on the type of AI engine underlying the tool. Probabilistic AI — the kind used in most general-purpose large language models — generates answers by inference, which introduces the risk of hallucinations and inconsistencies. Deterministic AI, like the engine behind Chata.ai's AutoQL, operates differently: it applies defined logic to your governed data, which means the same query returns the same validated answer every time. For KPI reporting specifically, deterministic AI is the more reliable foundation — and in many cases, more accurate than manual reports, which are subject to human error, stale data, and inconsistent metric definitions across teams. Learn more about how deterministic AI works.
What's the difference between automated reporting and automated alerts in AI analytics?
Automated reporting delivers structured outputs — summaries, tables, charts — on a fixed schedule. Automated alerts, on the other hand, are trigger-based: the system monitors KPIs continuously and notifies users the moment a threshold is crossed or an anomaly is detected. The two work together — scheduled reporting keeps teams informed on a cadence, while alerts catch what can't wait for the next report.
Stop Waiting for Your KPIs — Make Them Come to You
The real question for any organization that depends on KPI reporting isn't whether their platform can answer questions. It's whether the platform is working when nobody's asking. Whether the anomaly on Thursday gets surfaced on Thursday. Whether the weekly report lands with built-in analysis and zero manual effort. Whether the team is spending time making decisions — not hunting for the numbers behind them.
That's the shift proactive analytics makes. And it's worth understanding before your next KPI arrives two days too late to act on.
Chata.ai is built to make that a reality: automated reports with built-in analysis, real-time KPI alerts, and a deterministic AI engine that ensures every insight you receive is accurate, governed, and permissioned — without any manual effort from your team.
Book a demo with Chata.ai and see what KPI reporting looks like when it works the way it should.
More Updates


