Topics

Help teams explore data without compromising privacy.
Help teams explore data without compromising privacy.
Natural Language Queries in Action: Ask, Visualize, Analyze, and Follow Up

Published
9 min read
Topics:
Self-Service Analytics
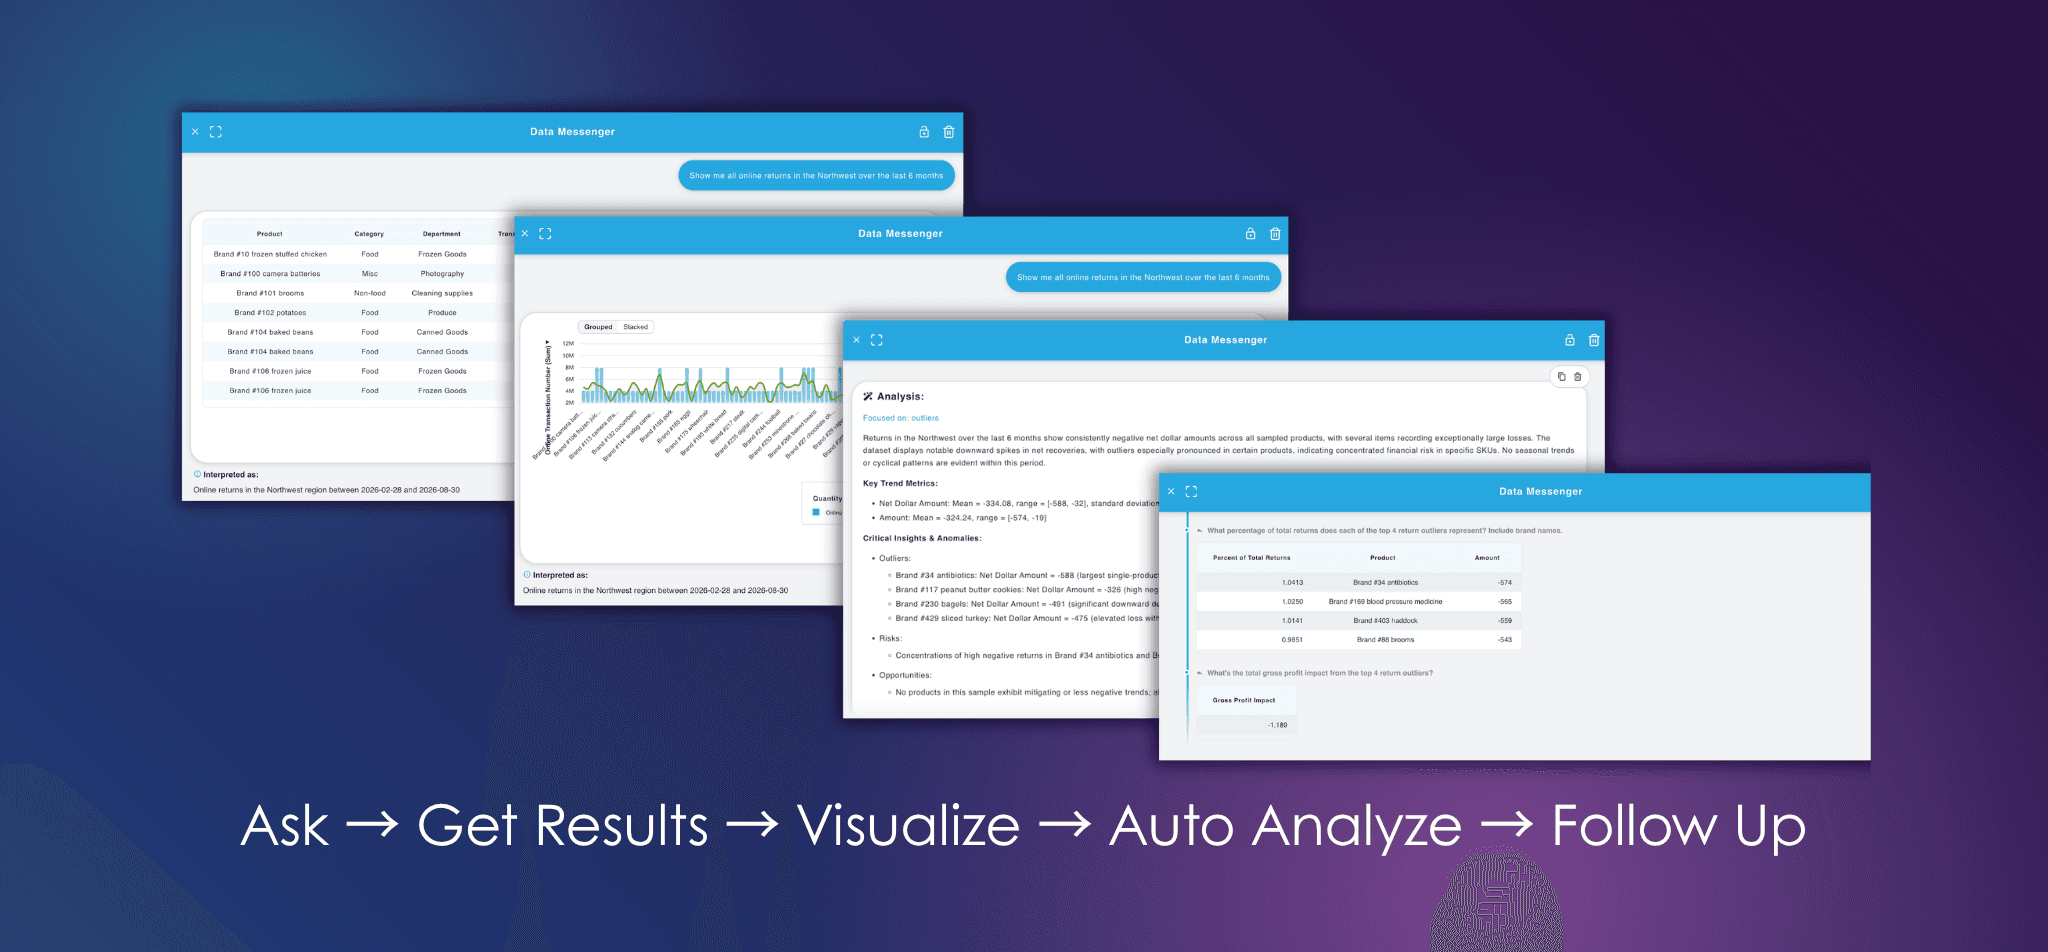
Table of Contents
Natural Language Queries Are More Than a Single Question
A Natural Language Query (NLQ) is a question typed or spoken in everyday language that a system translates into a database query and answers without requiring the user to write SQL. So, instead of learning a query language, you just ask, and the software figures out what data to pull and how to pull it.
NLQ matters because plain language is the most natural form of communication people already know how to use. Nobody needs training to ask a question; they've been doing it their whole life. That's what makes NLQ so effective for self-service analytics: it removes the technical barrier between a person and their data, so getting an answer becomes as simple as asking for one.
Most explanations of NLQ stop there, treating the question-and-answer exchange as the whole story. In practice, that single answer is rarely the end of the analysis; it's the beginning of one. A person sees a number, wants to see it as a chart, notices something odd, asks why, and wants to compare it to last year. A tool that only handles the first question isn't offering real self-service analytics; it's offering a search bar with better manners.
When looking for a conversational analytics platform, you’ll want to use a natural-language question is the entry point into an interactive workflow, not the destination. That workflow follows several connected steps:
Ask — describe what you want to know in plain language
Visualize — turn the resulting table into a chart with one click
Explore/Follow Up — ask contextual follow-up questions that build on the last result
AI analysis— let the system summarize what the data actually shows
Let’s walk through each step using a sales-data scenario, by connecting the dots from a single query to an automated, reusable analysis.
What Are Natural Language Query Examples?
Before walking through the workflow, it helps to see what NLQ actually sounds like in a business setting. Natural language query examples typically fall into a few recurring patterns:
Filtering: "Show me sales in the Northeast region for Q2."
Aggregation: "What is our total revenue by product category this year?"
Comparison: "How did this month's sales compare to last month?"
Ranking: "Which five sales reps closed the most deals in March?"
Trend detection: "Show me monthly revenue for the past 12 months."
What makes these useful isn't just that they avoid SQL syntax, it's that they mirror how people actually think about their business. Nobody opens a meeting asking for a GROUP BY clause; they ask "why did sales drop in March?" The value of natural language to SQL translation is that it closes the gap between how a question is asked and how a database needs it phrased, without forcing the person asking to learn the difference.
However, a single answered example, on its own, only proves the translation works. It doesn't show what a person does after they see the result, which is where most real analysis actually happens. The flexibility to ask questions beyond any examples is what makes the analytics platform truly useful and self-serve.
NLQ Workflow: Ask → Visualize → Explore → Follow Up
The top barrier to self-service analytics adoption isn't always a data access; it's the inability to pursue a finding once the initial query returns results. Users hit an answer, notice something interesting, and immediately run into a wall. The tool can't keep up with the next question.
Real analysis should provide the ability to dive deeper. When results surface unexpected patterns, those patterns generate new questions. Those questions need answers quickly, in context, without starting from scratch.
Consider a sales manager who wants to understand where returns are hurting him the most. It looks like this:
Ask: "Show me all online returns in the Northwest over the last 6 months."
Get results: A table appears listing every online return transaction in the region over that window, product, quantity, amount, and gross profit impact, row by row.
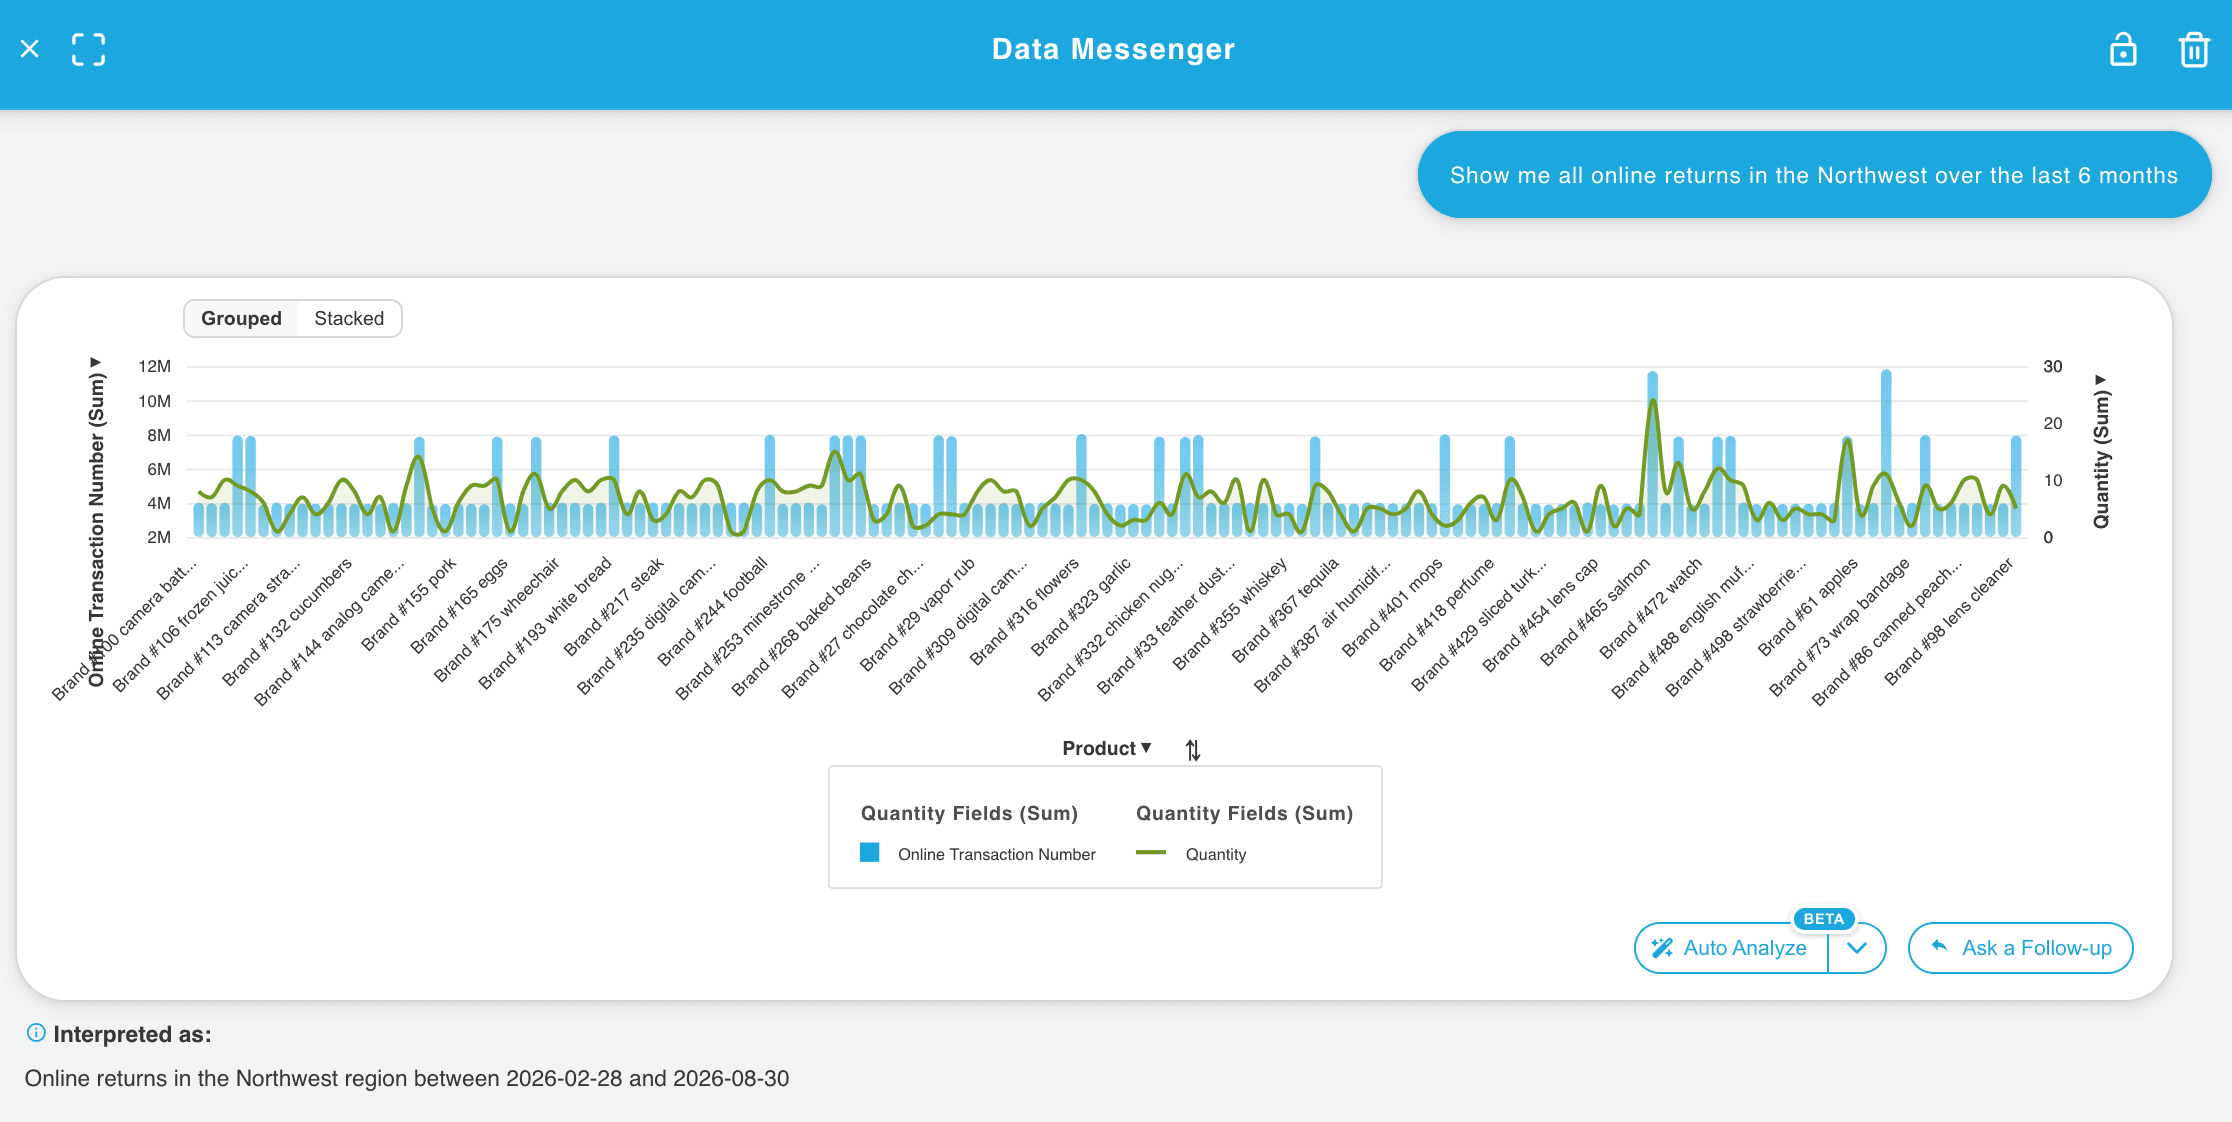
Visualize: He clicks a chart icon and turns the table into a bar chart by product.
Ask AI to analyze results: Rather than scanning the full result set line by line, he can run AI analysis focused on outliers or any other area.
Explore further: With the outliers named, he goes back to the original results and asks, "What's the total gross profit impact from the top 4 return outliers?"
He can go and ask further questions he'd like to. For example: "What percentage of total returns does each of the top 4 return outliers represent? Include brand names."
Each step uses the same conversational interface; no new tool, no exported spreadsheet, no handoff to an analyst. This is the core of conversational analytics: the system keeps context across the entire session, so the manager can investigate a finding the moment he notices it, rather than starting over.
The sections below unpack each stage of this scenario and how Chata.ai handles these areas in more detail.
Ask: Turn a Business Question into a Data Query
The manager starts with a business question, not a technical one:
“Show me all online returns in the Northwest over the last 6 months.”
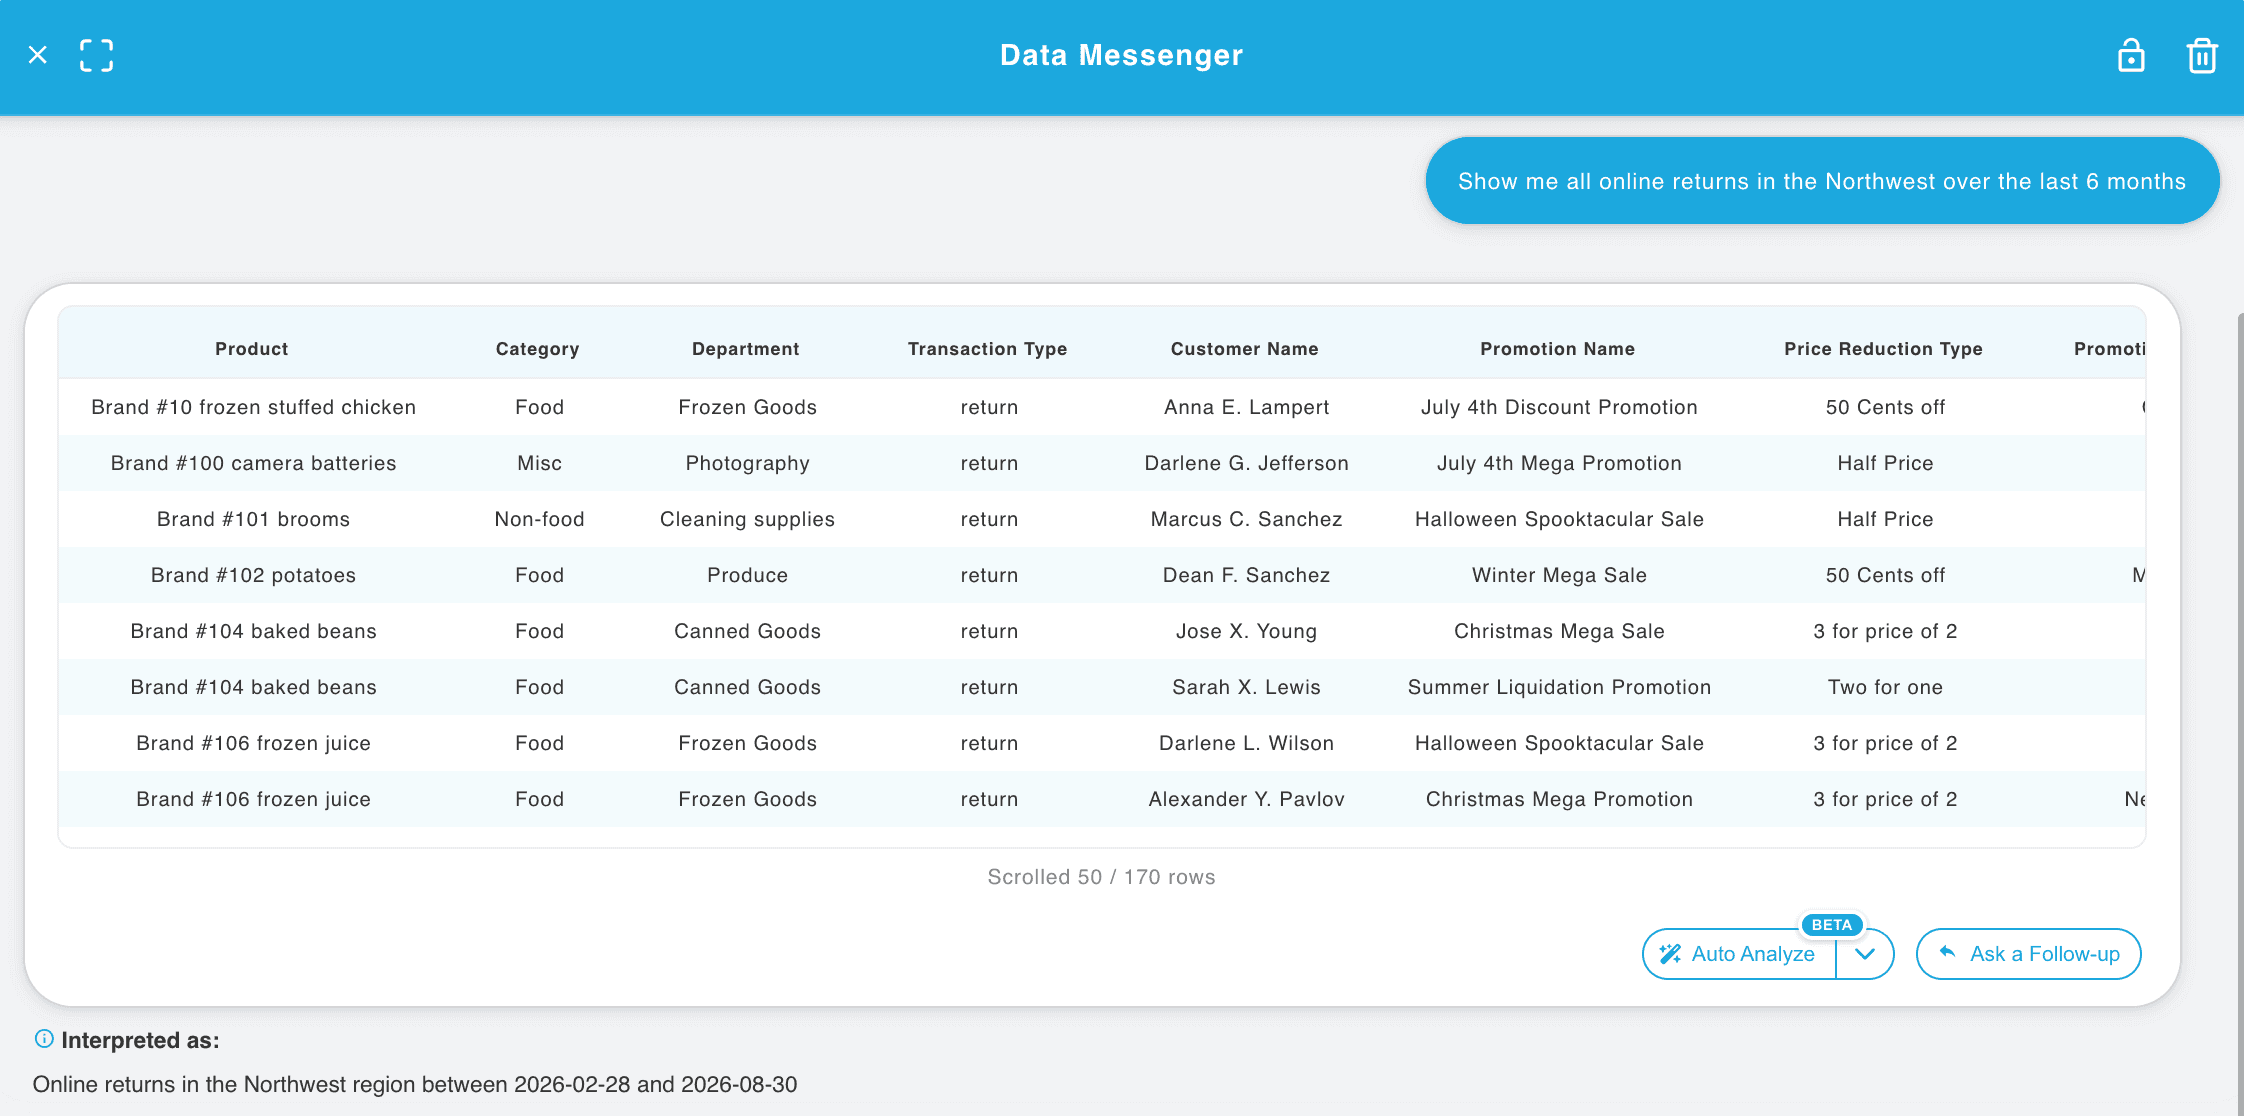
That single sentence requires filtering by transaction type, region, and channel, then bounding the result to a rolling six-month window. Written as SQL, it would involve joins across a transactions table and a date dimension, conditional filtering on transaction type and region, not something most business users can write from scratch, and not something they should need to.
Chata.ai parses the question, identifies the relevant table, filters, and time window, and returns the answer as a clean results table: product, quantity, amount, and gross profit impact for every matching return, laid out in rows the manager can scan immediately.
This is the part of NLQ that gets the most attention, and for good reason — it’s what lets someone query data with natural language instead of waiting on a report request or learning a BI tool’s query builder. A table of numbers is a starting point for interpretation, not the interpretation itself. The next step is turning that table into something faster to read.
Visualize: Move From Results to Charts With One Click
With the results table on screen, the manager doesn’t need to type another question to see it as a chart. Chata.ai displays chart-type icons alongside the results: bar, line, pie, and others appropriate to the data, so he simply clicks the one that fits.
Selecting the bar chart icon turns the product-by-product return log into a visual where a handful of bars clearly rise above the rest — something that’s easy to miss scrolling through a long list of transactions but hard to miss once it’s a chart.
This distinction matters: the natural language query gets him to the data, but built-in visualization tools help him present it. One click keeps him in the flow of looking, not asking.
Once he has a view worth keeping, he can save the query table, chart, and filters together as a dashboard. That turns a one-off analysis into a living asset his team can open next week, next month, or next quarter, with the underlying data refreshed automatically.
This is where natural language analytics stop being a single interaction and start becoming a reusable part of how the team monitors the business.
AI Analysis: Turn Query Results into Automated Insights
Interpreting which patterns are statistically meaningful, which changes are outliers versus normal variance, and what the findings imply for action requires time, context, and a layer of analysis that most business users don’t have on demand.
Rather than scanning the full result set line by line, the manager runs Auto Analyze, Chata.ai advanced analysis layer on top of queried data. Auto Analyze reads the verified query results and generates a deep analysis of what stands out, without requiring him to ask a specific question about each return individually.
It surfaces four returns far outside the norm, led by Brand #34 antibiotics at nearly double the average loss, and confirms they’re spread across unrelated categories rather than tied to one product line, ruling out a single systemic cause like one bad batch or one problem vendor.
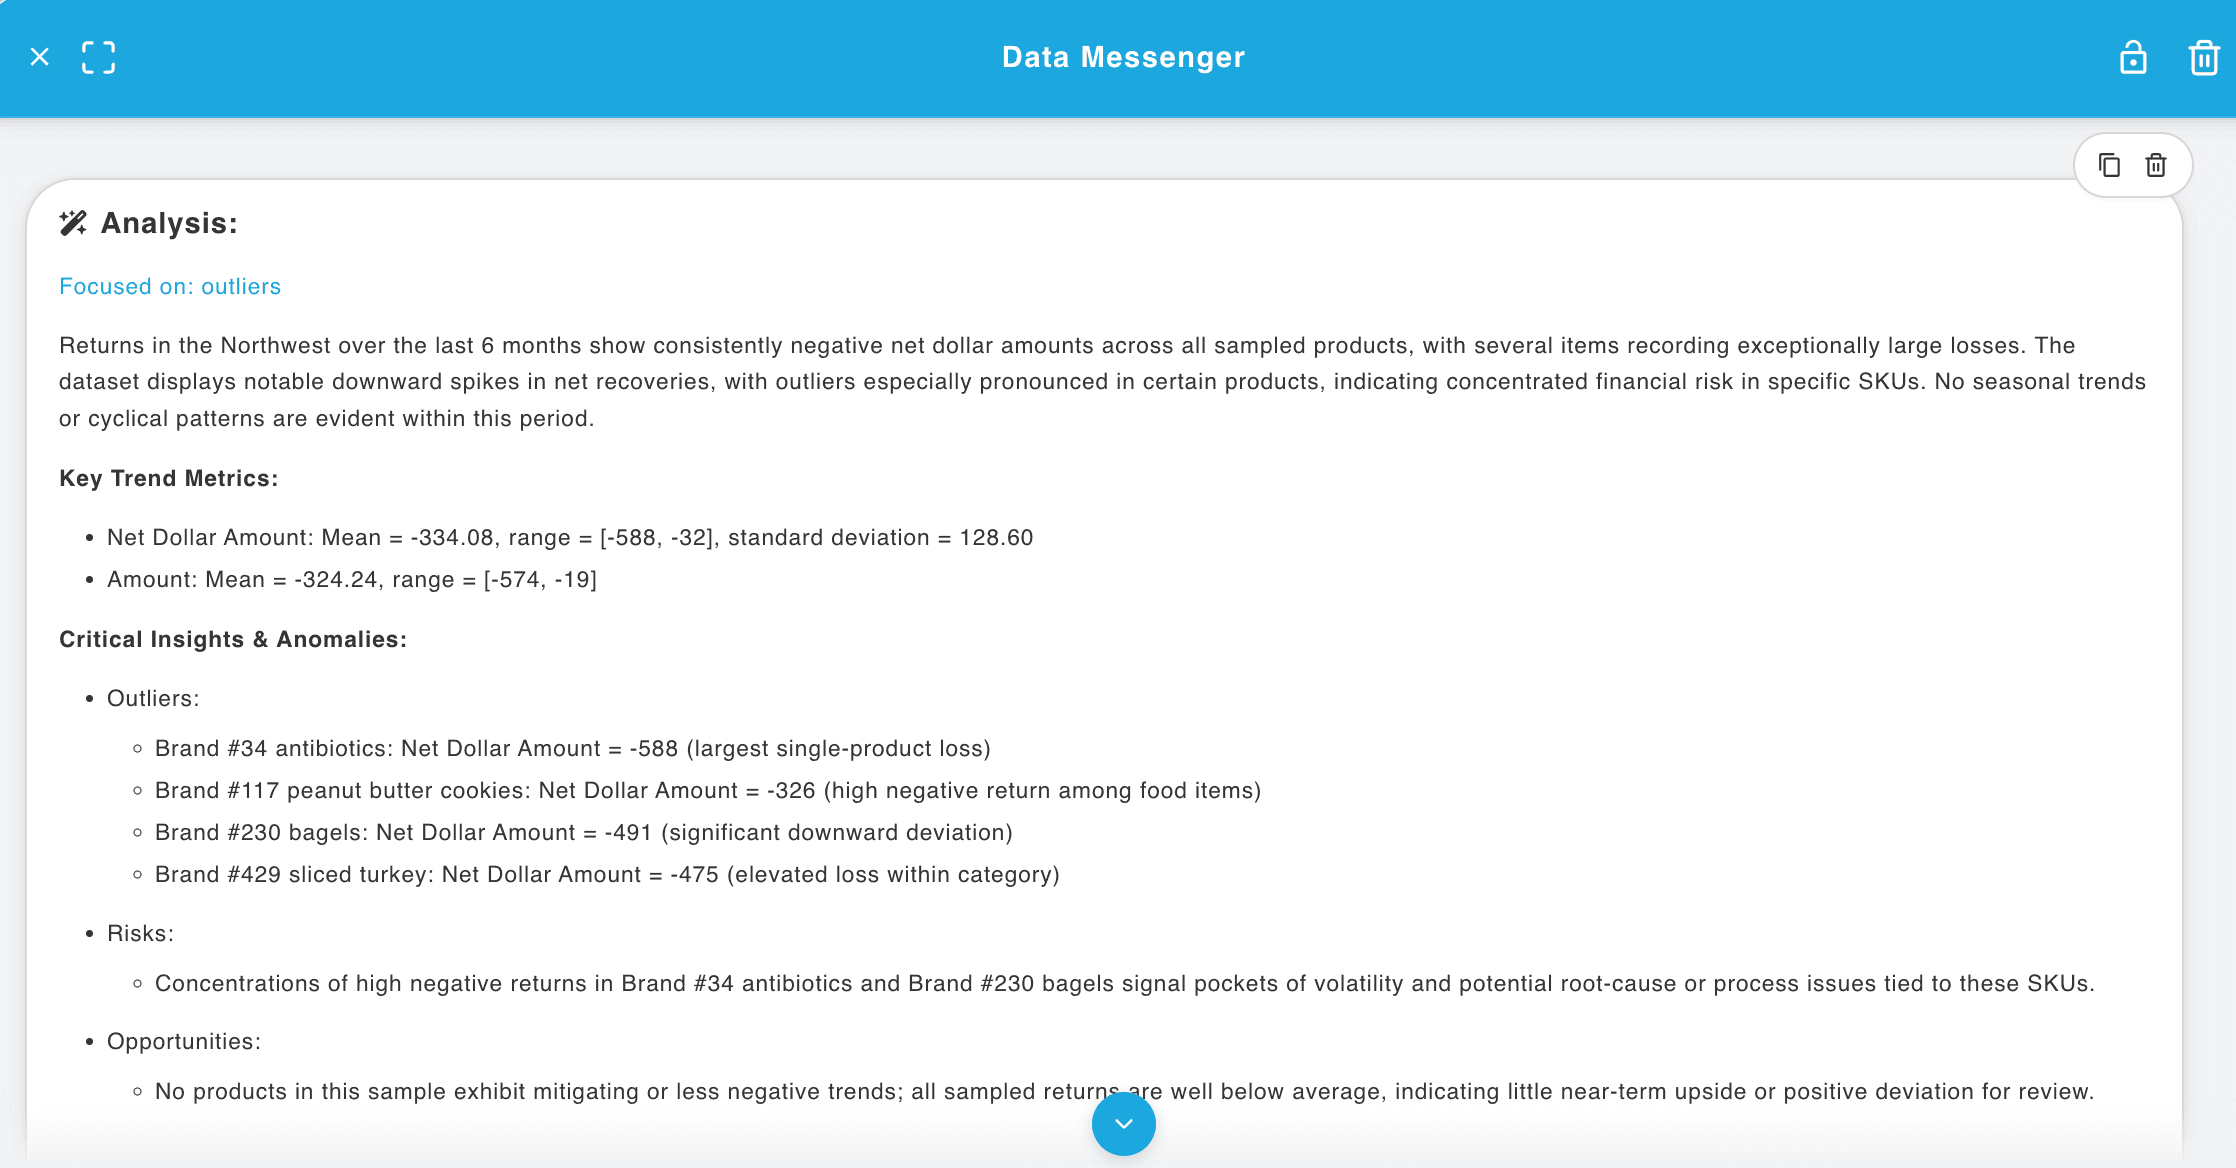
This is the shift from “here is the data” to “here is what the data means.” The chart caught his eye; Auto Analyze names exactly which returns are driving it and confirms the cause isn’t a single fixable source.
Follow Up: Keep Exploring the Same Analysis in Conversation
For users, it's natural for them to want to continue asking questions about the same topic or details. This has become the norm with many LLM conversational interfaces and users have come to know it well. At Chata.ai we saw this user workflow and implemented it within our conversational analytics platform. We maintain conversation context by allowing users to as sequential follow up questions about the original results table that was returned to them. This allows them to discover more details without having to restructure their query to ask additional details.
Chata.ai maintains conversation context by keeping the initial results table in scope. Each follow-up question is answered against that same table.
Auto Analyze named the four outliers; the follow-ups let the manager put a number on what they actually cost. With the outliers named, he goes back to the original results and asks:
“What’s the total gross profit impact from the top 4 return outliers?”
Chata.ai understands this question against the table already on screen: it filters the existing result set down to those four returns and sums the gross profit impact, without him needing to re-specify the region, the time window, or re-run the original query. It carries that table forward, the way a colleague would if he already had the numbers in front of him.
From there, he can ask futher without breaking stride, still working from the same table:
“What percentage of total returns does each of the top 4 return outliers represent? Include brand names.”
Now he has a specific, named breakdown — exactly how much each of those four products is costing him and what share of the total loss it represents, enough to flag the right ones by name in a review instead of pointing at a vague trend.
Each question is short because it doesn’t have to repeat what’s already been established or pull in new data. That’s the practical benefit of conversational context in analytics. It mirrors how someone would actually dig into a flagged finding with a data analyst sitting next to them, asking one clarifying question after another about the same result set instead of re-explaining the whole problem each time.

The Full Path: Ask → Get Results → Visualize → Auto Analyze → Follow Up
Put together, the full path looks like this:
Ask → Get results → Visualize → Auto Analyze → Follow up
Chata.ai’s Natural Language Queries experience isn’t simply about replacing SQL with plain English. It connects the initial question to visual exploration that catches the eye, automated analysis that names and confirms what matters, and contextual follow-ups grounded in the same verified result.
The result is that the work of asking a good question and the work of understanding the answer happen in the same place, in the same conversation.
FAQs
What is the difference between NLQ and NLP?
Natural Language Processing (NLP) is the broader field of computer science concerned with understanding and generating human language. It covers everything from chatbots to translation to sentiment analysis.
Natural Language Query (NLQ) is a specific application of NLP techniques, focused narrowly on converting a plain-language question into a structured data query, typically SQL, and returning results from a database.
In short: NLP is the underlying technology; NLQ is one practical use of that technology in analytics.
How do Natural Language Queries work?
An NLQ system takes a plain-language question, identifies the intent — filter, aggregate, compare, rank, and so on — maps the relevant terms to tables, columns, and metrics in the connected data source, and generates the corresponding query behind the scenes.
The query runs against the database, and the results are returned to the user as a table, chart, or summary.
Do I need to know SQL to use natural language queries?
No. That’s the core premise of NLQ-driven, self-service analytics: the system handles the translation from plain English to SQL, so business users can filter, aggregate, and compare data without writing or understanding query syntax themselves.
With Chata.ai, technical users can access query history to audit every query.
Is a natural language query platform the same as a chatbot for data?
Not exactly. A chatbot implies open-ended conversation; NLQ is specifically about querying structured data and getting back verifiable results: tables, charts, and numbers grounded in the underlying database, not generated text.
Level Up Your NLQ Experience
Get a number back, and the real work is just beginning — you want to see it, question it, compare it. Chata.ai stays with you through all of it: instant charts, automatic analysis, and follow-up questions that help you discover the insights the way you need it.
Topics
Help teams explore data without compromising privacy.
Natural Language Queries in Action: Ask, Visualize, Analyze, and Follow Up
Published
9 min read
Topics:
Self-Service Analytics
Table of Contents
Natural Language Queries Are More Than a Single Question
A Natural Language Query (NLQ) is a question typed or spoken in everyday language that a system translates into a database query and answers without requiring the user to write SQL. So, instead of learning a query language, you just ask, and the software figures out what data to pull and how to pull it.
NLQ matters because plain language is the most natural form of communication people already know how to use. Nobody needs training to ask a question; they've been doing it their whole life. That's what makes NLQ so effective for self-service analytics: it removes the technical barrier between a person and their data, so getting an answer becomes as simple as asking for one.
Most explanations of NLQ stop there, treating the question-and-answer exchange as the whole story. In practice, that single answer is rarely the end of the analysis; it's the beginning of one. A person sees a number, wants to see it as a chart, notices something odd, asks why, and wants to compare it to last year. A tool that only handles the first question isn't offering real self-service analytics; it's offering a search bar with better manners.
When looking for a conversational analytics platform, you’ll want to use a natural-language question is the entry point into an interactive workflow, not the destination. That workflow follows several connected steps:
Ask — describe what you want to know in plain language
Visualize — turn the resulting table into a chart with one click
Explore/Follow Up — ask contextual follow-up questions that build on the last result
AI analysis— let the system summarize what the data actually shows
Let’s walk through each step using a sales-data scenario, by connecting the dots from a single query to an automated, reusable analysis.
What Are Natural Language Query Examples?
Before walking through the workflow, it helps to see what NLQ actually sounds like in a business setting. Natural language query examples typically fall into a few recurring patterns:
Filtering: "Show me sales in the Northeast region for Q2."
Aggregation: "What is our total revenue by product category this year?"
Comparison: "How did this month's sales compare to last month?"
Ranking: "Which five sales reps closed the most deals in March?"
Trend detection: "Show me monthly revenue for the past 12 months."
What makes these useful isn't just that they avoid SQL syntax, it's that they mirror how people actually think about their business. Nobody opens a meeting asking for a GROUP BY clause; they ask "why did sales drop in March?" The value of natural language to SQL translation is that it closes the gap between how a question is asked and how a database needs it phrased, without forcing the person asking to learn the difference.
However, a single answered example, on its own, only proves the translation works. It doesn't show what a person does after they see the result, which is where most real analysis actually happens. The flexibility to ask questions beyond any examples is what makes the analytics platform truly useful and self-serve.
NLQ Workflow: Ask → Visualize → Explore → Follow Up
The top barrier to self-service analytics adoption isn't always a data access; it's the inability to pursue a finding once the initial query returns results. Users hit an answer, notice something interesting, and immediately run into a wall. The tool can't keep up with the next question.
Real analysis should provide the ability to dive deeper. When results surface unexpected patterns, those patterns generate new questions. Those questions need answers quickly, in context, without starting from scratch.
Consider a sales manager who wants to understand where returns are hurting him the most. It looks like this:
Ask: "Show me all online returns in the Northwest over the last 6 months."
Get results: A table appears listing every online return transaction in the region over that window, product, quantity, amount, and gross profit impact, row by row.
Visualize: He clicks a chart icon and turns the table into a bar chart by product.
Ask AI to analyze results: Rather than scanning the full result set line by line, he can run AI analysis focused on outliers or any other area.
Explore further: With the outliers named, he goes back to the original results and asks, "What's the total gross profit impact from the top 4 return outliers?"
He can go and ask further questions he'd like to. For example: "What percentage of total returns does each of the top 4 return outliers represent? Include brand names."
Each step uses the same conversational interface; no new tool, no exported spreadsheet, no handoff to an analyst. This is the core of conversational analytics: the system keeps context across the entire session, so the manager can investigate a finding the moment he notices it, rather than starting over.
The sections below unpack each stage of this scenario and how Chata.ai handles these areas in more detail.
Ask: Turn a Business Question into a Data Query
The manager starts with a business question, not a technical one:
“Show me all online returns in the Northwest over the last 6 months.”
That single sentence requires filtering by transaction type, region, and channel, then bounding the result to a rolling six-month window. Written as SQL, it would involve joins across a transactions table and a date dimension, conditional filtering on transaction type and region, not something most business users can write from scratch, and not something they should need to.
Chata.ai parses the question, identifies the relevant table, filters, and time window, and returns the answer as a clean results table: product, quantity, amount, and gross profit impact for every matching return, laid out in rows the manager can scan immediately.
This is the part of NLQ that gets the most attention, and for good reason — it’s what lets someone query data with natural language instead of waiting on a report request or learning a BI tool’s query builder. A table of numbers is a starting point for interpretation, not the interpretation itself. The next step is turning that table into something faster to read.
Visualize: Move From Results to Charts With One Click
With the results table on screen, the manager doesn’t need to type another question to see it as a chart. Chata.ai displays chart-type icons alongside the results: bar, line, pie, and others appropriate to the data, so he simply clicks the one that fits.
Selecting the bar chart icon turns the product-by-product return log into a visual where a handful of bars clearly rise above the rest — something that’s easy to miss scrolling through a long list of transactions but hard to miss once it’s a chart.
This distinction matters: the natural language query gets him to the data, but built-in visualization tools help him present it. One click keeps him in the flow of looking, not asking.
Once he has a view worth keeping, he can save the query table, chart, and filters together as a dashboard. That turns a one-off analysis into a living asset his team can open next week, next month, or next quarter, with the underlying data refreshed automatically.
This is where natural language analytics stop being a single interaction and start becoming a reusable part of how the team monitors the business.
AI Analysis: Turn Query Results into Automated Insights
Interpreting which patterns are statistically meaningful, which changes are outliers versus normal variance, and what the findings imply for action requires time, context, and a layer of analysis that most business users don’t have on demand.
Rather than scanning the full result set line by line, the manager runs Auto Analyze, Chata.ai advanced analysis layer on top of queried data. Auto Analyze reads the verified query results and generates a deep analysis of what stands out, without requiring him to ask a specific question about each return individually.
It surfaces four returns far outside the norm, led by Brand #34 antibiotics at nearly double the average loss, and confirms they’re spread across unrelated categories rather than tied to one product line, ruling out a single systemic cause like one bad batch or one problem vendor.
This is the shift from “here is the data” to “here is what the data means.” The chart caught his eye; Auto Analyze names exactly which returns are driving it and confirms the cause isn’t a single fixable source.
Follow Up: Keep Exploring the Same Analysis in Conversation
For users, it's natural for them to want to continue asking questions about the same topic or details. This has become the norm with many LLM conversational interfaces and users have come to know it well. At Chata.ai we saw this user workflow and implemented it within our conversational analytics platform. We maintain conversation context by allowing users to as sequential follow up questions about the original results table that was returned to them. This allows them to discover more details without having to restructure their query to ask additional details.
Chata.ai maintains conversation context by keeping the initial results table in scope. Each follow-up question is answered against that same table.
Auto Analyze named the four outliers; the follow-ups let the manager put a number on what they actually cost. With the outliers named, he goes back to the original results and asks:
“What’s the total gross profit impact from the top 4 return outliers?”
Chata.ai understands this question against the table already on screen: it filters the existing result set down to those four returns and sums the gross profit impact, without him needing to re-specify the region, the time window, or re-run the original query. It carries that table forward, the way a colleague would if he already had the numbers in front of him.
From there, he can ask futher without breaking stride, still working from the same table:
“What percentage of total returns does each of the top 4 return outliers represent? Include brand names.”
Now he has a specific, named breakdown — exactly how much each of those four products is costing him and what share of the total loss it represents, enough to flag the right ones by name in a review instead of pointing at a vague trend.
Each question is short because it doesn’t have to repeat what’s already been established or pull in new data. That’s the practical benefit of conversational context in analytics. It mirrors how someone would actually dig into a flagged finding with a data analyst sitting next to them, asking one clarifying question after another about the same result set instead of re-explaining the whole problem each time.
The Full Path: Ask → Get Results → Visualize → Auto Analyze → Follow Up
Put together, the full path looks like this:
Ask → Get results → Visualize → Auto Analyze → Follow up
Chata.ai’s Natural Language Queries experience isn’t simply about replacing SQL with plain English. It connects the initial question to visual exploration that catches the eye, automated analysis that names and confirms what matters, and contextual follow-ups grounded in the same verified result.
The result is that the work of asking a good question and the work of understanding the answer happen in the same place, in the same conversation.
FAQs
What is the difference between NLQ and NLP?
Natural Language Processing (NLP) is the broader field of computer science concerned with understanding and generating human language. It covers everything from chatbots to translation to sentiment analysis.
Natural Language Query (NLQ) is a specific application of NLP techniques, focused narrowly on converting a plain-language question into a structured data query, typically SQL, and returning results from a database.
In short: NLP is the underlying technology; NLQ is one practical use of that technology in analytics.
How do Natural Language Queries work?
An NLQ system takes a plain-language question, identifies the intent — filter, aggregate, compare, rank, and so on — maps the relevant terms to tables, columns, and metrics in the connected data source, and generates the corresponding query behind the scenes.
The query runs against the database, and the results are returned to the user as a table, chart, or summary.
Do I need to know SQL to use natural language queries?
No. That’s the core premise of NLQ-driven, self-service analytics: the system handles the translation from plain English to SQL, so business users can filter, aggregate, and compare data without writing or understanding query syntax themselves.
With Chata.ai, technical users can access query history to audit every query.
Is a natural language query platform the same as a chatbot for data?
Not exactly. A chatbot implies open-ended conversation; NLQ is specifically about querying structured data and getting back verifiable results: tables, charts, and numbers grounded in the underlying database, not generated text.
Level Up Your NLQ Experience
Get a number back, and the real work is just beginning — you want to see it, question it, compare it. Chata.ai stays with you through all of it: instant charts, automatic analysis, and follow-up questions that help you discover the insights the way you need it.
More Updates