Topics

Help teams explore data without compromising privacy.
Help teams explore data without compromising privacy.
Cross-Property Slot Performance Analysis: Find What's Working There but Not Here

Published
5 min read
Topics:
Gaming Analytics

Table of Contents
Most multi-property operators never see their biggest slot opportunities, because each property reports on its own. A game theme (game name) that holds well at one site and lags at another rarely gets noticed, let alone fixed. That gap is where cross-property slot performance analysis pays off. When the same game performs differently depending on floor placement, configuration, or player mix, the game isn't the problem. The context is, and context is fixable.
Your best casino already knows how to fix your worst one. You just haven't been able to ask the question across all your properties at once.
Why Casino Operations Teams Miss Their Easiest Slot Wins Across Properties
If you run slot operations across several casinos, you already own your best fixes. A game theme that performs at one site and lags at another usually needs a floor move, a configuration change, or a targeted promotion, not always a replacement.
The problem is visibility. Each property runs its own reports, so nobody on the operations team lines up the same game theme side by side. A theme with a hold percentage of 12% at one site and 8% at another looks acceptable in both reports, and the gap never reaches the weekly floor meeting.
Meanwhile, the cost builds on the floor. Underplayed units keep taking up space and vendor fees, promotions land on the wrong days, and good games get pulled when the real problem was where they sat. Operations ends up requesting new games when the fix was already in its own data.
Why the Same Slot Game Performs Differently at Properties
A performance gap between properties is a signal that something is fixable. Every root cause points to a different, low-cost action:
If the root cause is… | The fix is… | Cost |
|---|---|---|
Floor placement (high-traffic bank vs. back corner) | Move the machine | Low: a floor move |
Denomination or max bet configuration | Adjust the setup | Low: a pricing change |
Day-of-week play patterns | Run a targeted promotion on the weak day | Low: focused marketing spend |
Machine-level issue (downtime, access, vendor terms) | Inspect, replace, or renegotiate | Varies |
Your best-performing property becomes the playbook for the rest.
How Cross-Source Monitoring Fixes the Problem
The fix starts with watching every property's data continuously. Instead of waiting for someone to line up separate reports, cross-source monitoring compares the same game theme across every site and flags gaps as soon as they appear.
Chata.ai provides all possible tools to cover monitoring, automation and analytics.
Automated monitoring, reports and alerts
Self-service conversational exploration
Automated AI analysis
All secure, auditable, and using proprietary technology for data privacy.
Here is a flow of questions you can use for alerts and natural language exploration for cross-property slot performance analysis.
Alert: Find the Themes That Behave Differently
The alert runs across every game theme:
"Show me game themes that exist at all three properties with 3 or more machines at each, where the actual hold percentage differs by more than 2 points between the highest and lowest performing property over the last 6 months. Include game theme, manufacturer, property name, machine count, theo hold percentage, actual hold percentage, and the spread between properties."
Requiring 3+ machines per site removes small-sample noise.
Look for Time Patterns
"For [game theme], show me actual hold percentage and coin in per unit per day by day of week at each property over the last 3 months."
A game that dies on weekdays at one site is a player-mix issue, not a game issue.
Compare Denomination and Configuration
"For [game theme], compare denomination, max bet, average bet size, actual hold percentage, and theo hold percentage at each property."
A penny game at a $2 max bet attracts a different player than the same title at $5.
Check Floor Placement
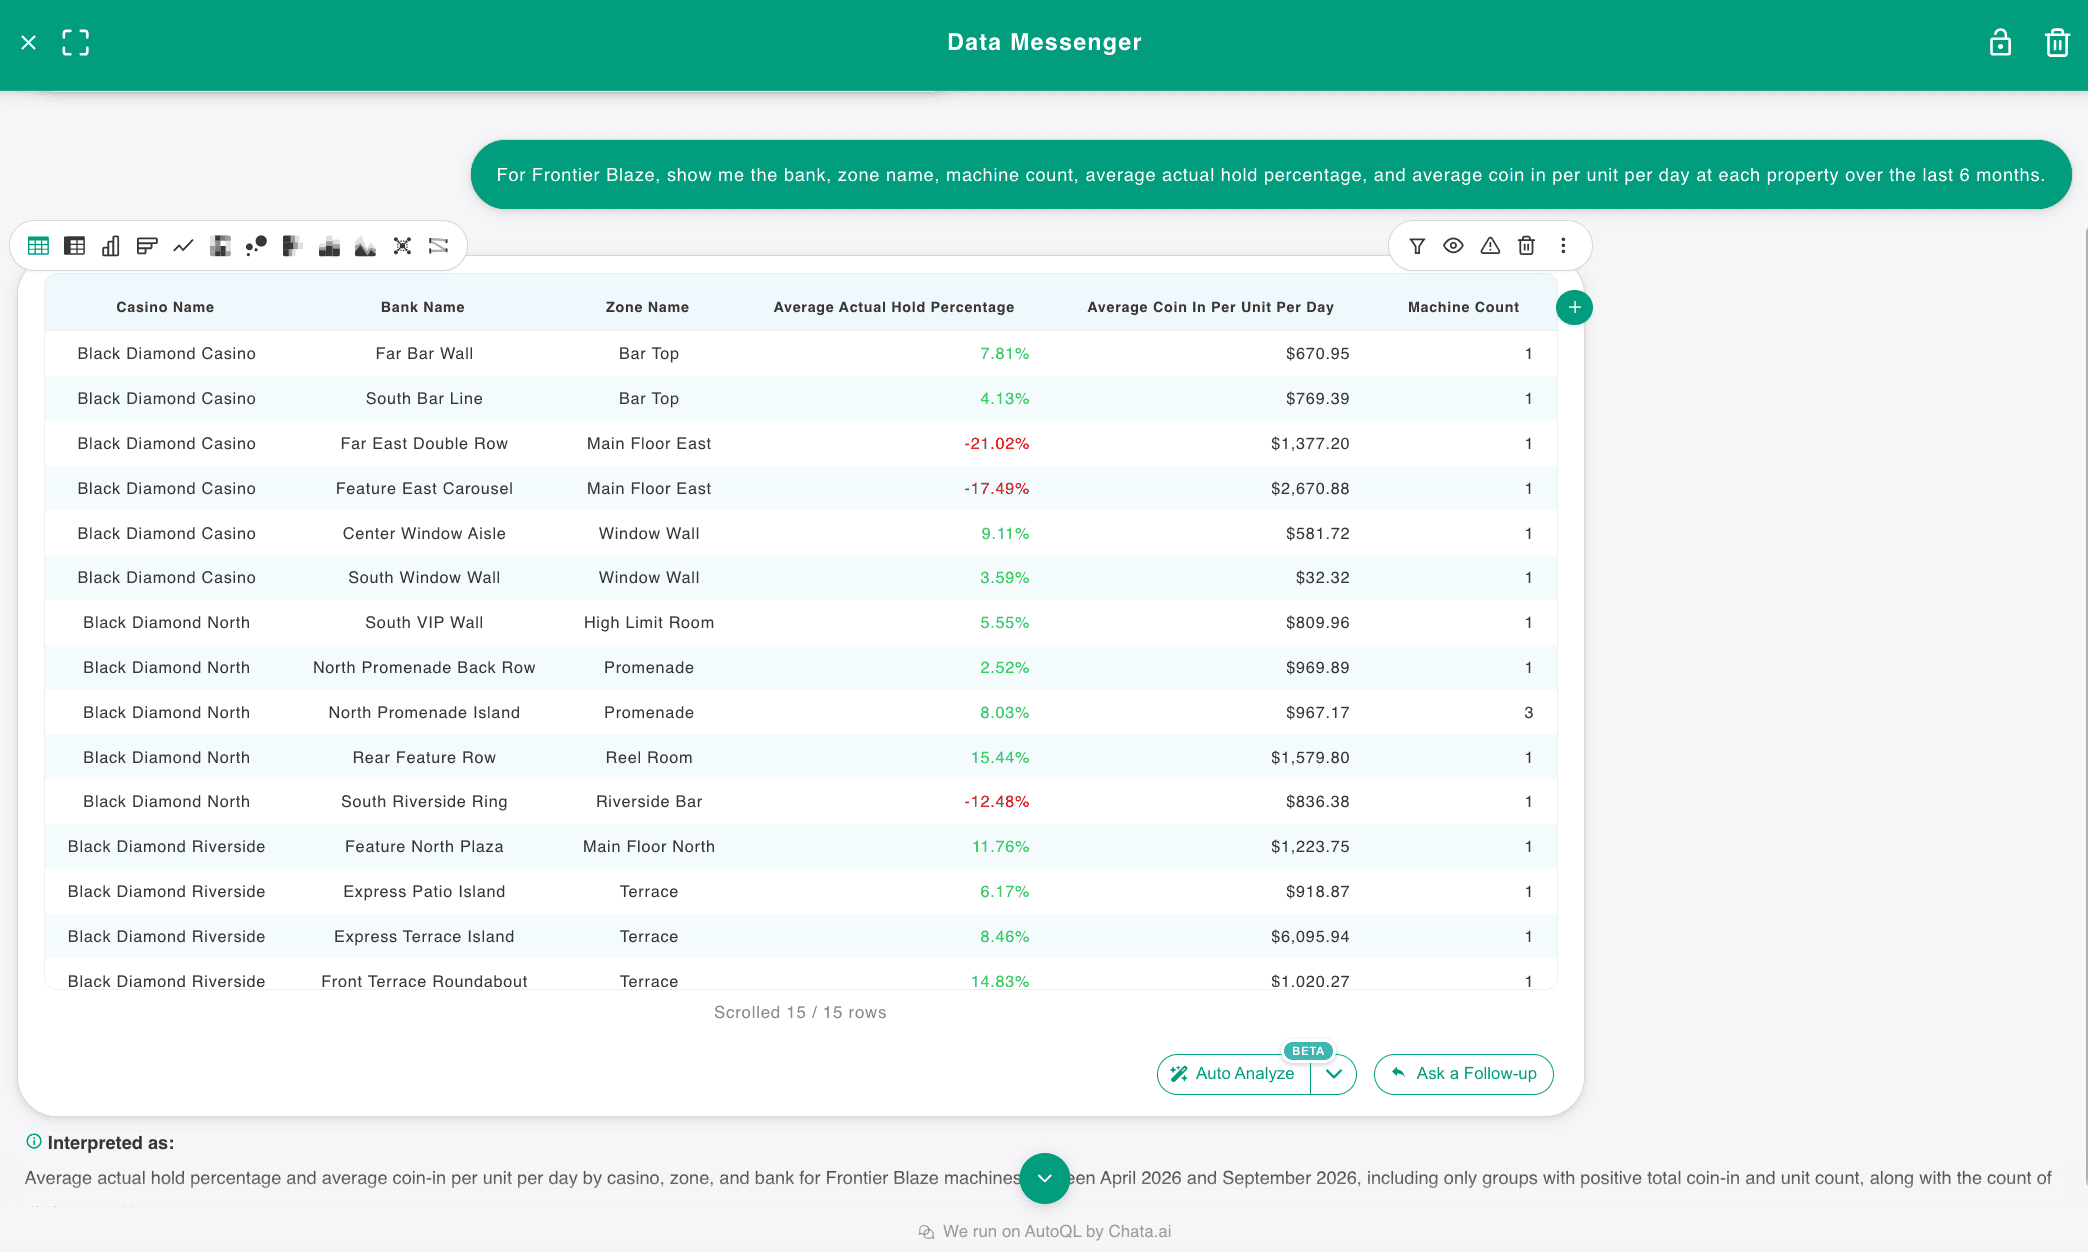
"For [game theme], show me the bank, zone, machine count, average actual hold percentage, and average coin in per unit per day at each property over the last 6 months."
Same game, a different spot on the floor?
Separate Patterns from Variance
"Show me game themes that were in the bottom 25% by actual hold percentage at one property but top 50% at another for 3 or more consecutive months, with at least 3 machines at each."
Three straight months is a pattern, and each result is a transferable fix.
Each answer shapes the next question, so the analysis moves from symptom to cause in minutes rather than weeks.
Example: Cross-Property Slot Performance Analysis of Frontier Blaze
Game Theme “Frontier Blaze” has nearly identical math at all three properties, yet actual hold differs by roughly 14 points. Black Diamond Riverside, location 1, delivers results closest to what the game is built to deliver, Black Diamond North, location 2, sits in the middle, while Black Diamond Casino, location 3, sits far below it.
So the question becomes not "can this game perform?" but "what's different about how it performs at casinos?"
Is It a Timing or Play-Pattern Problem?
Black Diamond Casino has the lowest coin in on 6 of 7 days. Tuesday is the only exception ($442 vs. Riverside's $357).
Thursday shows the widest gap: Black Diamond Casino (location 3) gets 53% less play than Black Diamond North (location 2) and 49% less than Black Diamond Riverside (location 1).
Black Diamond Casino's Sunday hold of −78.47% looked alarming, but Chata.ai traced it to a single $43,071.46 jackpot on machine SM749 on June 28. That is an event, not a trend.
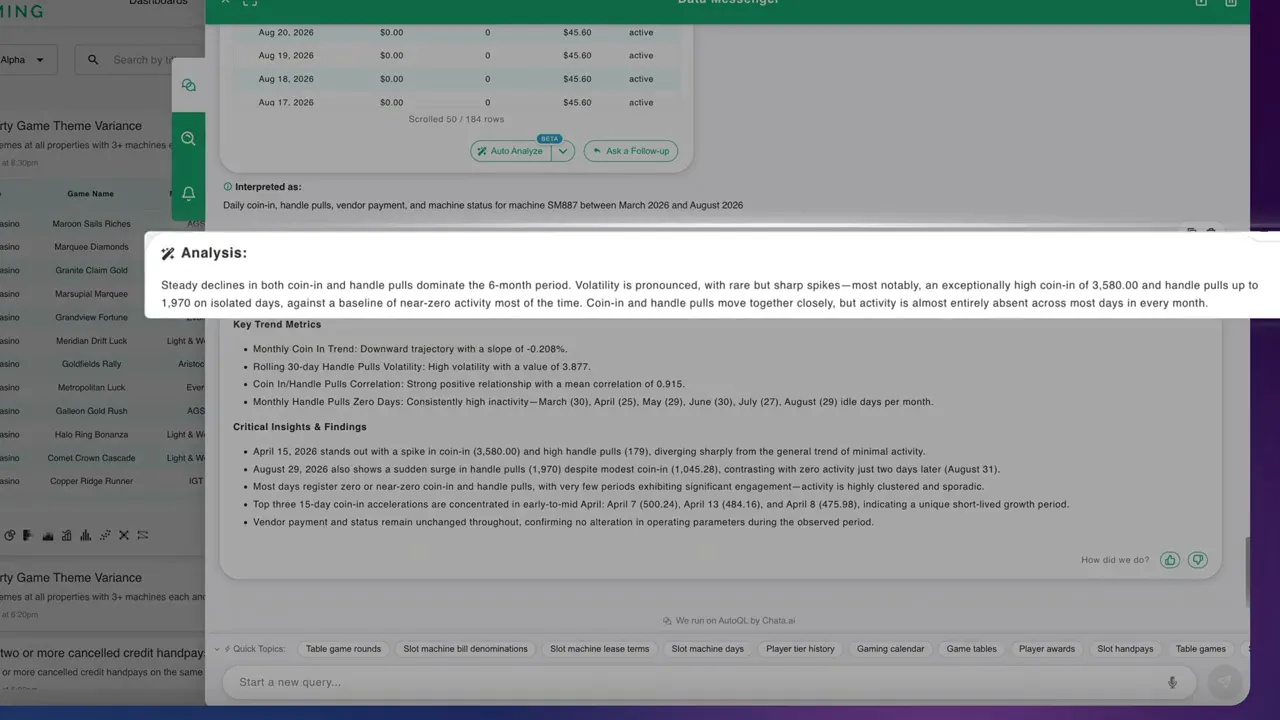
The drill-down also surfaced machine SM887 (Ghost Town Gold, $0.25, IGT HX-220). It was active but played on only 5 of 50 days, generating $1,234.94 in coin in against $2,280 in vendor payments ($45.60 per day).
Is the Machine Setup Different?
"Same game" didn't mean the same configuration. Frontier Blaze was running in six configurations, with theo hold ranging from 6.66% to 13.50%.
Average bet stayed between $1.00 and $1.58, and the highest average bet came from Black Diamond North's configuration with the lowest max bet. Black Diamond Casino's configuration with the highest max bet averaged only $1.00 per bet.
The data doesn't prove max bet is the cause, so treat it as a test, not an assumption. Measure average bet and coin in before and after any change.
Is It a Floor Placement Problem?
This was the clearest signal. Four of Black Diamond Casino's six Frontier Blaze units sit on the Bar Top or Window Wall, and they are its four lowest-played units.
Its two Main Floor East units earn $1,377 and $2,671 per day. Even the lower of the two earns 79% more than Black Diamond Casino's best Bar Top or Window Wall unit. The $32-per-day unit, on the South Window Wall, is the lowest of all 17 Frontier Blaze machines across the three properties.
The pattern shows up elsewhere too. At Black Diamond North, the Reel Room unit earns $1,580 per day, nearly double the $836 on the Riverside Bar.
One more lesson: three well-played units had negative hold but strong coin in, from $836 to $2,671 per day. Black Diamond Casino's busiest Frontier Blaze unit holds −17.49%. Negative hold on a busy machine is a hold-result issue, not a bad-location issue. Don't move a machine just because one number looks bad.
At Riverside, one unit on Bank Express Terrace Island earns $6,096 per day, nearly double the other three Riverside units combined.
What Should Operations Do Next?
The recommended sequence is a controlled test, one change at a time:
Test placement first. Move the $32-per-day unit from the Window Wall to Main Floor East. Compare its new coin in to its old baseline and to the $1,366 benchmark. If it works, move the next-lowest unit.
Use Thursday for any promotion test. It's where Casino's play gap is largest.
Test configuration separately. Try a higher max bet on the $2.50-max penny setup and measure average bet and coin in.
Protect proven positions. Leave well-played machines where they are, including Riverside's top unit at $6,820 per day, which out-earns the other three Riverside units combined.
Key Takeaways for Multi-Property Operators
A game that wins at one property and lags at another is usually a context problem, not a game problem.
Low play, not low hold, was the real issue at Black Diamond Casino: lowest coin in on 6 of 7 days.
Placement was the clearest lever. Bar Top and Window Wall units earned $32 to $831 per day; the Main Floor East unit earned $1,366.
Chata.ai separates events from patterns, such as a single $43,071 jackpot behind a −78% Sunday hold.
The fix is a floor move, a configuration test, or a targeted promotion. Not a purchase order.

Frequently Asked Questions
How do you compare slot performance across multiple properties?
Chata.ai's solution compares the same game theme across properties, measuring actual hold against theoretical hold over the same date range. Matching themes keeps the comparison fair, and filtering for themes with enough play at each site keeps the results meaningful. Operations can set an alert that fires whenever one property's hold for a theme lands more than 2 percentage points off the others.
From there, managers drill into day-of-week patterns, configuration, and floor placement with plain-language questions.
How can casinos improve slot performance without buying new games?
Move underplayed machines to higher-traffic zones, test configuration changes such as denomination or max bet, and run promotions only on the specific days where play lags. Test one change at a time so the result is clear.
What is cross-property slot performance analysis?
It's comparing the same game theme across your properties to find where performance diverges, then working out why. The goal isn't spotting the gap. It's the low-cost action that follows: turning your best property into a playbook for the rest.
Do I need SQL or a data team to run this analysis in Chata.ai?
No. Operators ask questions in plain language, and Chata.ai returns the answer from your connected data across all properties.
Why This Matters for Casino Operations Teams
Whenever the same thing performs differently from one place to another, whether a game, a zone, a shift, or a promotion, the difference tells you what to fix.
The operators who win are the ones who see those gaps early and act on them with what they already have.
Let's discuss your case. Whatever question you're trying to answer across your casino, tell us about it, and we'll show you how Chata.ai can help.
Topics
Help teams explore data without compromising privacy.
Cross-Property Slot Performance Analysis: Find What's Working There but Not Here
Published
5 min read
Topics:
Gaming Analytics
Table of Contents
Most multi-property operators never see their biggest slot opportunities, because each property reports on its own. A game theme (game name) that holds well at one site and lags at another rarely gets noticed, let alone fixed. That gap is where cross-property slot performance analysis pays off. When the same game performs differently depending on floor placement, configuration, or player mix, the game isn't the problem. The context is, and context is fixable.
Your best casino already knows how to fix your worst one. You just haven't been able to ask the question across all your properties at once.
Why Casino Operations Teams Miss Their Easiest Slot Wins Across Properties
If you run slot operations across several casinos, you already own your best fixes. A game theme that performs at one site and lags at another usually needs a floor move, a configuration change, or a targeted promotion, not always a replacement.
The problem is visibility. Each property runs its own reports, so nobody on the operations team lines up the same game theme side by side. A theme with a hold percentage of 12% at one site and 8% at another looks acceptable in both reports, and the gap never reaches the weekly floor meeting.
Meanwhile, the cost builds on the floor. Underplayed units keep taking up space and vendor fees, promotions land on the wrong days, and good games get pulled when the real problem was where they sat. Operations ends up requesting new games when the fix was already in its own data.
Why the Same Slot Game Performs Differently at Properties
A performance gap between properties is a signal that something is fixable. Every root cause points to a different, low-cost action:
If the root cause is… | The fix is… | Cost |
|---|---|---|
Floor placement (high-traffic bank vs. back corner) | Move the machine | Low: a floor move |
Denomination or max bet configuration | Adjust the setup | Low: a pricing change |
Day-of-week play patterns | Run a targeted promotion on the weak day | Low: focused marketing spend |
Machine-level issue (downtime, access, vendor terms) | Inspect, replace, or renegotiate | Varies |
Your best-performing property becomes the playbook for the rest.
How Cross-Source Monitoring Fixes the Problem
The fix starts with watching every property's data continuously. Instead of waiting for someone to line up separate reports, cross-source monitoring compares the same game theme across every site and flags gaps as soon as they appear.
Chata.ai provides all possible tools to cover monitoring, automation and analytics.
Automated monitoring, reports and alerts
Self-service conversational exploration
Automated AI analysis
All secure, auditable, and using proprietary technology for data privacy.
Here is a flow of questions you can use for alerts and natural language exploration for cross-property slot performance analysis.
Alert: Find the Themes That Behave Differently
The alert runs across every game theme:
"Show me game themes that exist at all three properties with 3 or more machines at each, where the actual hold percentage differs by more than 2 points between the highest and lowest performing property over the last 6 months. Include game theme, manufacturer, property name, machine count, theo hold percentage, actual hold percentage, and the spread between properties."
Requiring 3+ machines per site removes small-sample noise.
Look for Time Patterns
"For [game theme], show me actual hold percentage and coin in per unit per day by day of week at each property over the last 3 months."
A game that dies on weekdays at one site is a player-mix issue, not a game issue.
Compare Denomination and Configuration
"For [game theme], compare denomination, max bet, average bet size, actual hold percentage, and theo hold percentage at each property."
A penny game at a $2 max bet attracts a different player than the same title at $5.
Check Floor Placement
"For [game theme], show me the bank, zone, machine count, average actual hold percentage, and average coin in per unit per day at each property over the last 6 months."
Same game, a different spot on the floor?
Separate Patterns from Variance
"Show me game themes that were in the bottom 25% by actual hold percentage at one property but top 50% at another for 3 or more consecutive months, with at least 3 machines at each."
Three straight months is a pattern, and each result is a transferable fix.
Each answer shapes the next question, so the analysis moves from symptom to cause in minutes rather than weeks.
Example: Cross-Property Slot Performance Analysis of Frontier Blaze
Game Theme “Frontier Blaze” has nearly identical math at all three properties, yet actual hold differs by roughly 14 points. Black Diamond Riverside, location 1, delivers results closest to what the game is built to deliver, Black Diamond North, location 2, sits in the middle, while Black Diamond Casino, location 3, sits far below it.
So the question becomes not "can this game perform?" but "what's different about how it performs at casinos?"
Is It a Timing or Play-Pattern Problem?
Black Diamond Casino has the lowest coin in on 6 of 7 days. Tuesday is the only exception ($442 vs. Riverside's $357).
Thursday shows the widest gap: Black Diamond Casino (location 3) gets 53% less play than Black Diamond North (location 2) and 49% less than Black Diamond Riverside (location 1).
Black Diamond Casino's Sunday hold of −78.47% looked alarming, but Chata.ai traced it to a single $43,071.46 jackpot on machine SM749 on June 28. That is an event, not a trend.
The drill-down also surfaced machine SM887 (Ghost Town Gold, $0.25, IGT HX-220). It was active but played on only 5 of 50 days, generating $1,234.94 in coin in against $2,280 in vendor payments ($45.60 per day).
Is the Machine Setup Different?
"Same game" didn't mean the same configuration. Frontier Blaze was running in six configurations, with theo hold ranging from 6.66% to 13.50%.
Average bet stayed between $1.00 and $1.58, and the highest average bet came from Black Diamond North's configuration with the lowest max bet. Black Diamond Casino's configuration with the highest max bet averaged only $1.00 per bet.
The data doesn't prove max bet is the cause, so treat it as a test, not an assumption. Measure average bet and coin in before and after any change.
Is It a Floor Placement Problem?
This was the clearest signal. Four of Black Diamond Casino's six Frontier Blaze units sit on the Bar Top or Window Wall, and they are its four lowest-played units.
Its two Main Floor East units earn $1,377 and $2,671 per day. Even the lower of the two earns 79% more than Black Diamond Casino's best Bar Top or Window Wall unit. The $32-per-day unit, on the South Window Wall, is the lowest of all 17 Frontier Blaze machines across the three properties.
The pattern shows up elsewhere too. At Black Diamond North, the Reel Room unit earns $1,580 per day, nearly double the $836 on the Riverside Bar.
One more lesson: three well-played units had negative hold but strong coin in, from $836 to $2,671 per day. Black Diamond Casino's busiest Frontier Blaze unit holds −17.49%. Negative hold on a busy machine is a hold-result issue, not a bad-location issue. Don't move a machine just because one number looks bad.
At Riverside, one unit on Bank Express Terrace Island earns $6,096 per day, nearly double the other three Riverside units combined.
What Should Operations Do Next?
The recommended sequence is a controlled test, one change at a time:
Test placement first. Move the $32-per-day unit from the Window Wall to Main Floor East. Compare its new coin in to its old baseline and to the $1,366 benchmark. If it works, move the next-lowest unit.
Use Thursday for any promotion test. It's where Casino's play gap is largest.
Test configuration separately. Try a higher max bet on the $2.50-max penny setup and measure average bet and coin in.
Protect proven positions. Leave well-played machines where they are, including Riverside's top unit at $6,820 per day, which out-earns the other three Riverside units combined.
Key Takeaways for Multi-Property Operators
A game that wins at one property and lags at another is usually a context problem, not a game problem.
Low play, not low hold, was the real issue at Black Diamond Casino: lowest coin in on 6 of 7 days.
Placement was the clearest lever. Bar Top and Window Wall units earned $32 to $831 per day; the Main Floor East unit earned $1,366.
Chata.ai separates events from patterns, such as a single $43,071 jackpot behind a −78% Sunday hold.
The fix is a floor move, a configuration test, or a targeted promotion. Not a purchase order.
Frequently Asked Questions
How do you compare slot performance across multiple properties?
Chata.ai's solution compares the same game theme across properties, measuring actual hold against theoretical hold over the same date range. Matching themes keeps the comparison fair, and filtering for themes with enough play at each site keeps the results meaningful. Operations can set an alert that fires whenever one property's hold for a theme lands more than 2 percentage points off the others.
From there, managers drill into day-of-week patterns, configuration, and floor placement with plain-language questions.
How can casinos improve slot performance without buying new games?
Move underplayed machines to higher-traffic zones, test configuration changes such as denomination or max bet, and run promotions only on the specific days where play lags. Test one change at a time so the result is clear.
What is cross-property slot performance analysis?
It's comparing the same game theme across your properties to find where performance diverges, then working out why. The goal isn't spotting the gap. It's the low-cost action that follows: turning your best property into a playbook for the rest.
Do I need SQL or a data team to run this analysis in Chata.ai?
No. Operators ask questions in plain language, and Chata.ai returns the answer from your connected data across all properties.
Why This Matters for Casino Operations Teams
Whenever the same thing performs differently from one place to another, whether a game, a zone, a shift, or a promotion, the difference tells you what to fix.
The operators who win are the ones who see those gaps early and act on them with what they already have.
Let's discuss your case. Whatever question you're trying to answer across your casino, tell us about it, and we'll show you how Chata.ai can help.
More Updates