Topics

Help teams explore data without compromising privacy.
Help teams explore data without compromising privacy.
Proactive Data Monitoring Across Sources: How One Alert Replaces Manual Correlation

Published
9 min read
Topics:
Proactive Alerts
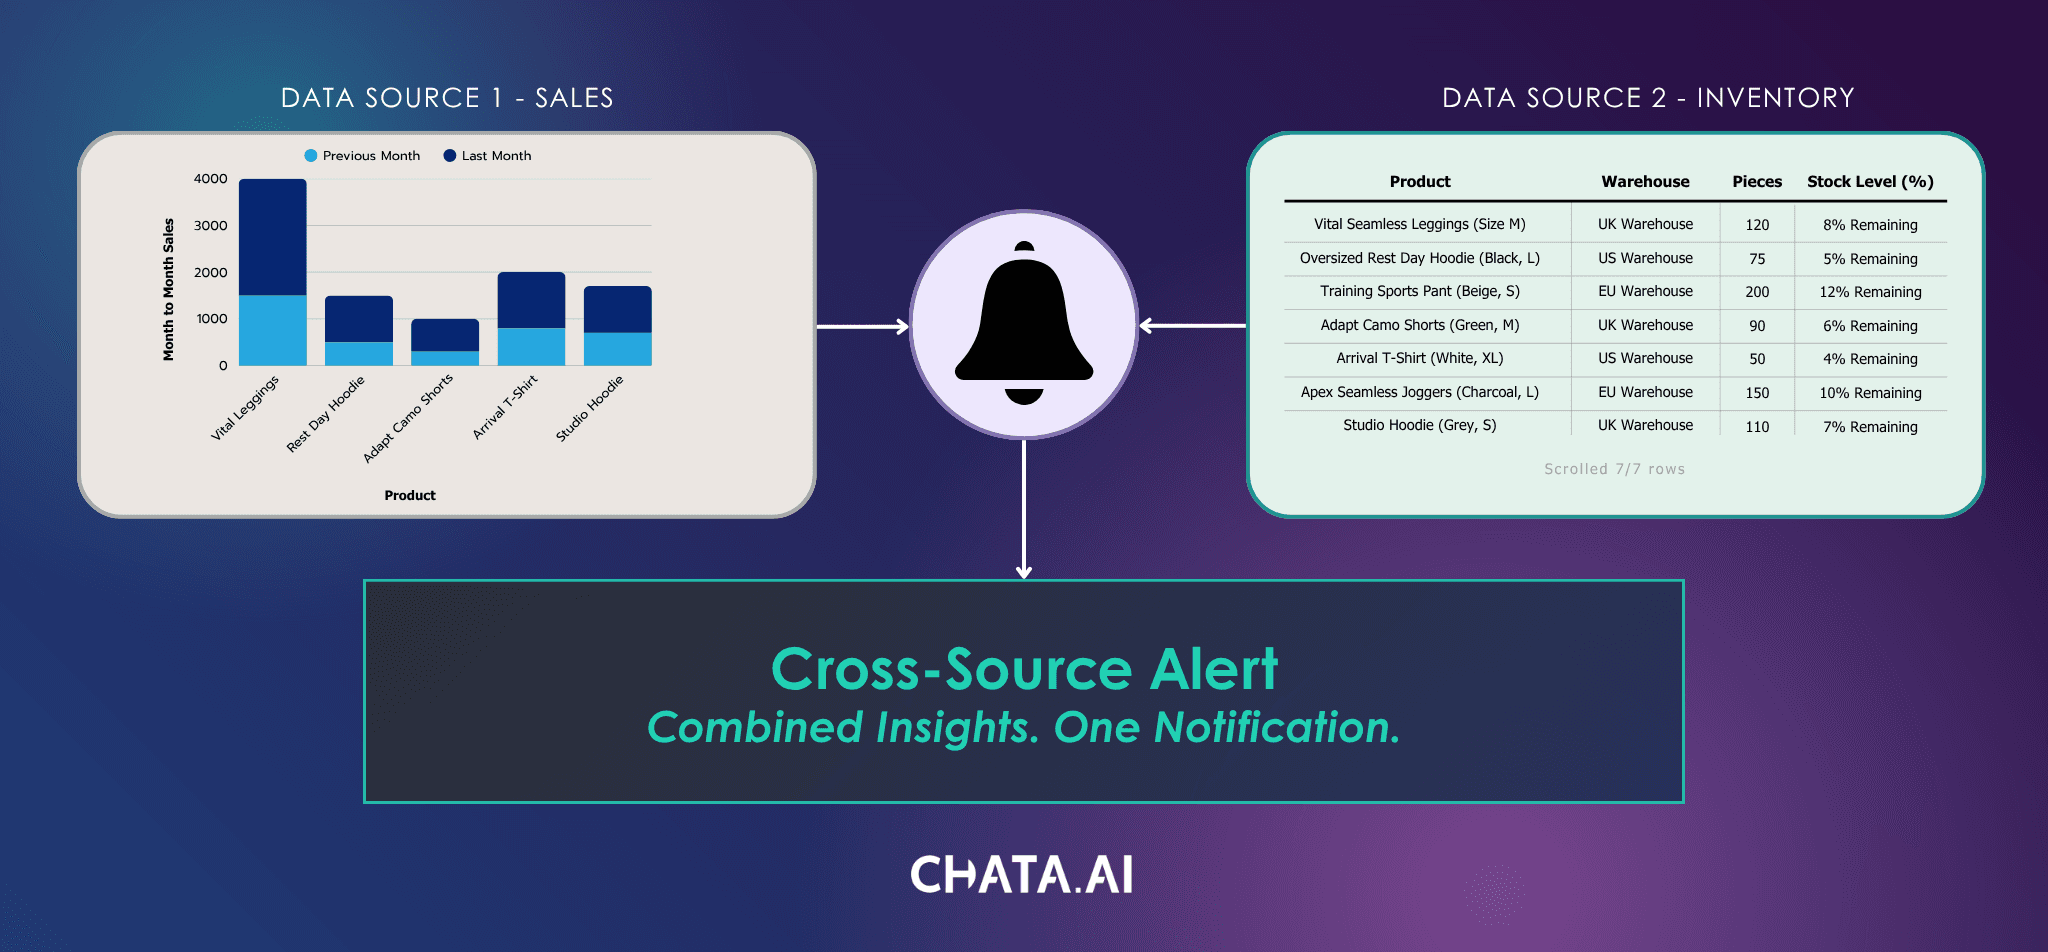
Table of Contents
Your business users receive alerts. Plenty of them. A metric crosses a threshold your data team configured, and the user gets pinged. No context. No connection to what's happening in the other three systems that touch the same process. And when they need more information, they either ignore the alert, submit another request that adds to your team's plate, or open four tabs and start cross-referencing manually.
Another scenario: your business users don't have alerts at all. They have dashboards. They check them when they remember to, which is either too often or not often enough. When something does go wrong, they find out during a report review or a meeting. After the fact. After it mattered.
Both setups have the same gap. Data monitoring, as most teams practice it, watches one system at a time. However, your operational data lives in more than one system, and the signals that matter most are the ones that span systems. A revenue dip in one source means something different when a behavioral shift is happening in another. Nobody is watching both at once, connecting the dots, and telling you in time to do something about it.
That's the problem proactive monitoring solves at a broad level. Cross-source alerts are the specific mechanism that makes it work. One notification, triggered by conditions across separate data sources, joined on a shared identifier, delivered with the actual data that caused it. Not a flag. Not a "something changed." The full picture, in one place, while you can still act on it.
How cross-source alerts work under the hood
The architecture is simpler than it sounds.
Each data source gets its own query model. The models connect independently, don't share data with each other, and don't move data out of the source system. They read in place.
Each model runs a deterministic query on a schedule. Same question, same answer, every time. When a condition is met, it generates an event. So far, this is just data monitoring. The part that makes cross-source alerts different from threshold alerts is what happens next.
Events from two separate sources can be joined on a shared identifier. That identifier is any field that exists in both systems. A product ID, an account number, a zone code, a machine group, a customer segment. Whatever makes sense for your data. Data teams define the join when they configure the alert.

When conditions are met in both events for the same identifier, one notification fires. That notification carries both signals and the actual records that triggered them. Not "Alert: threshold breached in System A." Instead: here's what changed in System A, here's the correlated signal in System B, here are the specific records, here are the numbers.
If the data doesn't support the alert, it doesn't fire. The underlying query is deterministic. There's no probabilistic layer guessing whether the signal is real. Either the condition is met against actual data, or it isn't. When it isn't, you hear nothing. When it is, you get one notification with everything attached. And if multiple records breach the condition in a single cycle, you still get one notification with all of them. Not ten separate pings. One message, all records, full context. That’s proactive data monitoring across sources.
Data teams build them. Business users subscribe.
There's a clean split between who configures cross-source alerts and who receives them.
Data and analytics teams set up the rules for proactive monitoring in the Integrator Portal. They define the conditions for each source including what data gets included and when the polling is scheduled and then choose the join identifier. This is where the technical work happens. It requires understanding the schema and knowing which fields are shared across sources.
Business users never touch any of that. They subscribe to alerts from the alerting interface. Pick the ones relevant to your role, choose your delivery channel, done. No configuration. No SQL. No understanding of the underlying join logic required.
Delivery channels include email (routed through the customer's own email infrastructure), mobile push, the web app, and API integrations for connecting alerts to other systems. Most teams start with email and webhook during validation, then expand to mobile push once the rules are proven.
If something breaks in the underlying data connection, both sides see the error. The admin sees it in the portal. The subscriber sees it in the notification. No silent failures.
Use case: casino floor operations
A casino resort generates data from systems that never talk to each other. The casino management system tracks floor performance: which games are getting play, how much revenue each zone generates, what the player mix looks like by segment. The property management system tracks hotel reservations, group bookings, and guest profiles. The entertainment side tracks event schedules and ticket sales.
These systems serve different departments. The floor team watches the CMS. The hotel team watches the PMS. Nobody is connecting next week's guest profile with what the floor should look like when they arrive.
Today, floor optimization is reactive. Managers adjust based on what they're seeing in real time or what last weekend's report told them. When a big event brings in a specific crowd, the floor team finds out what that crowd wants by watching it happen. By the time they've read the pattern and responded, the weekend is half over.
Here's what a cross-source alert does with this.
A data analyst sets up two conditions. First, in the property management system: flag when next week's hotel bookings skew more than 20% toward a specific demographic segment. Second, in the CMS: pull historical floor performance for that segment, including which game types, denominations, and zones perform strongest.
A classic rock act is playing Saturday. Hotel bookings for the week are running 65% guests aged 55 and older, well above the usual mix. The CMS shows that historically, this segment plays classic reel and penny slots at nearly double the rate of the floor average, with longer sessions and higher per-visit spend.

One notification fires days before the weekend starts:
Next week guest profile: 65% aged 55+, driven by Saturday concert booking block. Historical match: this segment plays classic reel and penny slots at 1.8x floor average. Avg session 40% longer. Current floor allocation to classic/penny: 28%.
The floor manager gets this on Monday. Not Saturday night when it's too late. Monday, with enough time to adjust the game mix, move machines, brief the hosts, and set the floor up for the audience that's actually coming.
Even a conservative estimate puts the difference at thousands per weekend. If reallocating 15% of the floor to match a known audience preference adds just a few extra percentage points of utilization on higher-performing machines, that compounds across every shift the audience is in the building. A casino that reacts to the crowd after it arrives absorbs that cost every hour it takes to read the pattern. One that sees both signals together, guest profile and historical performance, captures it from the first hour.

Use case: credit union compliance
A mid-size credit union in the Pacific Northwest runs compliance monitoring across two systems that don't talk to each other. Transaction data sits in the core banking platform. Risk indicators and suspicious activity flags live in a separate anti-money laundering monitoring tool. When transaction patterns spike and risk flags activate on the same account at the same time, that overlap is often the earliest signal that something needs investigation.
Today, an analyst catches that overlap by pulling transaction summaries, cross-referencing them against the compliance platform, and documenting what lines up. On a normal day, this works. During quarter-end close, exam prep, or holiday weekends, it doesn't. The compliance team hasn't grown in two years, but reporting requirements have. Every new regulation, every expanded filing obligation, every additional field the examiners want to see adds to the queue. The backlog gets longer. The compliance clock gets shorter.
The correlations that get missed aren't the obvious ones. They're the patterns that only become visible when you look at both systems together. Often by the time someone gets to them manually, the window to act has narrowed or closed.
A cross-source alert watches both systems at once. It joins "transaction volume anomaly" in the core banking system with "risk flag active" in the compliance data monitoring tool. The connection point is the member account ID, which exists in both systems.
When both conditions trigger on the same account, one notification fires:
Account 5528-XXXX. 11 transactions in 75 minutes (norm: 2). Total value: $38,600. Correlated risk flag: unusual transaction speed and geographic spread. Transactions originated from 4 regions within the monitoring window.

The compliance analyst sees the transaction pattern and the risk indicator together, with the specific records attached. They didn't have to go find it. They didn't have to build a report. And it didn't get buried in the backlog because it happened during the busiest week of the quarter.
For a regulated institution, there's another layer. The alert itself is an audit trail. The query that produced it is deterministic and fully inspectable: which tables were queried, which joins were used, which filters were applied, what data was returned. Security from the source systems carries through. Permissions are enforced before the query runs, not filtered from the results after.
When an examiner asks "how did you identify this activity," the answer isn't "an analyst was reviewing reports." The answer is the query. Run it again next month. Same conditions, same result. That's not a feature added after the fact. It's how the engine works.
The pattern applies beyond financial services. A retailer connecting POS transaction data with supply chain inventory. A telecom operator correlating network performance with customer complaint volume. A manufacturer linking equipment sensor data with production output. Wherever decisions depend on signals living in separate systems, the problem is the same: by the time someone manually connects the dots, the moment to act has passed.
Read about How to Catch CTR Aggregation and Structuring Across Systems
Set up proactive alerts without moving your data
The technical buyer reading this is probably thinking: connecting and monitoring across sources sounds like it requires data consolidation. A warehouse project. An ETL pipeline. Months of work before you see anything.
It doesn't.
Each model connects to its source independently and reads data in place. No data movement. No replication. No unified warehouse required. The correlation happens at the insight layer, not the data layer. Insights get connected. Data stays where it is.
Security carries through from your source systems. Row-level and column-level security, enforced before the query runs, not filtered after. The compliance use case above shows what that looks like in practice.
Deployment is flexible: multi-tenant SaaS, single-tenant, hybrid, on-prem, air-gapped, and edge. Data never leaves your environment. That's architectural, not a configuration option.
Cross-source alerts are one part of the broader proactive monitoring approach. For situations where you need to compare values within a single data source rather than combine data across sources, comparative alerts handle that.
Does proactive monitoring across sources apply to you?
Three signals that cross-source alerts fit your environment: your operational data lives in more than one system, your team currently correlates signals across those systems manually, and delayed insight has a real cost, whether that's lost revenue, compliance exposure, or operational escalation.
Chata.ai connects to structured databases, warehouses, and APIs using standard drivers and protocols. If your data is queryable, it's connectable.
Topics
Help teams explore data without compromising privacy.
Proactive Data Monitoring Across Sources: How One Alert Replaces Manual Correlation
Published
9 min read
Topics:
Proactive Alerts
Table of Contents
Your business users receive alerts. Plenty of them. A metric crosses a threshold your data team configured, and the user gets pinged. No context. No connection to what's happening in the other three systems that touch the same process. And when they need more information, they either ignore the alert, submit another request that adds to your team's plate, or open four tabs and start cross-referencing manually.
Another scenario: your business users don't have alerts at all. They have dashboards. They check them when they remember to, which is either too often or not often enough. When something does go wrong, they find out during a report review or a meeting. After the fact. After it mattered.
Both setups have the same gap. Data monitoring, as most teams practice it, watches one system at a time. However, your operational data lives in more than one system, and the signals that matter most are the ones that span systems. A revenue dip in one source means something different when a behavioral shift is happening in another. Nobody is watching both at once, connecting the dots, and telling you in time to do something about it.
That's the problem proactive monitoring solves at a broad level. Cross-source alerts are the specific mechanism that makes it work. One notification, triggered by conditions across separate data sources, joined on a shared identifier, delivered with the actual data that caused it. Not a flag. Not a "something changed." The full picture, in one place, while you can still act on it.
How cross-source alerts work under the hood
The architecture is simpler than it sounds.
Each data source gets its own query model. The models connect independently, don't share data with each other, and don't move data out of the source system. They read in place.
Each model runs a deterministic query on a schedule. Same question, same answer, every time. When a condition is met, it generates an event. So far, this is just data monitoring. The part that makes cross-source alerts different from threshold alerts is what happens next.
Events from two separate sources can be joined on a shared identifier. That identifier is any field that exists in both systems. A product ID, an account number, a zone code, a machine group, a customer segment. Whatever makes sense for your data. Data teams define the join when they configure the alert.
When conditions are met in both events for the same identifier, one notification fires. That notification carries both signals and the actual records that triggered them. Not "Alert: threshold breached in System A." Instead: here's what changed in System A, here's the correlated signal in System B, here are the specific records, here are the numbers.
If the data doesn't support the alert, it doesn't fire. The underlying query is deterministic. There's no probabilistic layer guessing whether the signal is real. Either the condition is met against actual data, or it isn't. When it isn't, you hear nothing. When it is, you get one notification with everything attached. And if multiple records breach the condition in a single cycle, you still get one notification with all of them. Not ten separate pings. One message, all records, full context. That’s proactive data monitoring across sources.
Data teams build them. Business users subscribe.
There's a clean split between who configures cross-source alerts and who receives them.
Data and analytics teams set up the rules for proactive monitoring in the Integrator Portal. They define the conditions for each source including what data gets included and when the polling is scheduled and then choose the join identifier. This is where the technical work happens. It requires understanding the schema and knowing which fields are shared across sources.
Business users never touch any of that. They subscribe to alerts from the alerting interface. Pick the ones relevant to your role, choose your delivery channel, done. No configuration. No SQL. No understanding of the underlying join logic required.
Delivery channels include email (routed through the customer's own email infrastructure), mobile push, the web app, and API integrations for connecting alerts to other systems. Most teams start with email and webhook during validation, then expand to mobile push once the rules are proven.
If something breaks in the underlying data connection, both sides see the error. The admin sees it in the portal. The subscriber sees it in the notification. No silent failures.
Use case: casino floor operations
A casino resort generates data from systems that never talk to each other. The casino management system tracks floor performance: which games are getting play, how much revenue each zone generates, what the player mix looks like by segment. The property management system tracks hotel reservations, group bookings, and guest profiles. The entertainment side tracks event schedules and ticket sales.
These systems serve different departments. The floor team watches the CMS. The hotel team watches the PMS. Nobody is connecting next week's guest profile with what the floor should look like when they arrive.
Today, floor optimization is reactive. Managers adjust based on what they're seeing in real time or what last weekend's report told them. When a big event brings in a specific crowd, the floor team finds out what that crowd wants by watching it happen. By the time they've read the pattern and responded, the weekend is half over.
Here's what a cross-source alert does with this.
A data analyst sets up two conditions. First, in the property management system: flag when next week's hotel bookings skew more than 20% toward a specific demographic segment. Second, in the CMS: pull historical floor performance for that segment, including which game types, denominations, and zones perform strongest.
A classic rock act is playing Saturday. Hotel bookings for the week are running 65% guests aged 55 and older, well above the usual mix. The CMS shows that historically, this segment plays classic reel and penny slots at nearly double the rate of the floor average, with longer sessions and higher per-visit spend.
One notification fires days before the weekend starts:
Next week guest profile: 65% aged 55+, driven by Saturday concert booking block. Historical match: this segment plays classic reel and penny slots at 1.8x floor average. Avg session 40% longer. Current floor allocation to classic/penny: 28%.
The floor manager gets this on Monday. Not Saturday night when it's too late. Monday, with enough time to adjust the game mix, move machines, brief the hosts, and set the floor up for the audience that's actually coming.
Even a conservative estimate puts the difference at thousands per weekend. If reallocating 15% of the floor to match a known audience preference adds just a few extra percentage points of utilization on higher-performing machines, that compounds across every shift the audience is in the building. A casino that reacts to the crowd after it arrives absorbs that cost every hour it takes to read the pattern. One that sees both signals together, guest profile and historical performance, captures it from the first hour.
Use case: credit union compliance
A mid-size credit union in the Pacific Northwest runs compliance monitoring across two systems that don't talk to each other. Transaction data sits in the core banking platform. Risk indicators and suspicious activity flags live in a separate anti-money laundering monitoring tool. When transaction patterns spike and risk flags activate on the same account at the same time, that overlap is often the earliest signal that something needs investigation.
Today, an analyst catches that overlap by pulling transaction summaries, cross-referencing them against the compliance platform, and documenting what lines up. On a normal day, this works. During quarter-end close, exam prep, or holiday weekends, it doesn't. The compliance team hasn't grown in two years, but reporting requirements have. Every new regulation, every expanded filing obligation, every additional field the examiners want to see adds to the queue. The backlog gets longer. The compliance clock gets shorter.
The correlations that get missed aren't the obvious ones. They're the patterns that only become visible when you look at both systems together. Often by the time someone gets to them manually, the window to act has narrowed or closed.
A cross-source alert watches both systems at once. It joins "transaction volume anomaly" in the core banking system with "risk flag active" in the compliance data monitoring tool. The connection point is the member account ID, which exists in both systems.
When both conditions trigger on the same account, one notification fires:
Account 5528-XXXX. 11 transactions in 75 minutes (norm: 2). Total value: $38,600. Correlated risk flag: unusual transaction speed and geographic spread. Transactions originated from 4 regions within the monitoring window.
The compliance analyst sees the transaction pattern and the risk indicator together, with the specific records attached. They didn't have to go find it. They didn't have to build a report. And it didn't get buried in the backlog because it happened during the busiest week of the quarter.
For a regulated institution, there's another layer. The alert itself is an audit trail. The query that produced it is deterministic and fully inspectable: which tables were queried, which joins were used, which filters were applied, what data was returned. Security from the source systems carries through. Permissions are enforced before the query runs, not filtered from the results after.
When an examiner asks "how did you identify this activity," the answer isn't "an analyst was reviewing reports." The answer is the query. Run it again next month. Same conditions, same result. That's not a feature added after the fact. It's how the engine works.
The pattern applies beyond financial services. A retailer connecting POS transaction data with supply chain inventory. A telecom operator correlating network performance with customer complaint volume. A manufacturer linking equipment sensor data with production output. Wherever decisions depend on signals living in separate systems, the problem is the same: by the time someone manually connects the dots, the moment to act has passed.
Read about How to Catch CTR Aggregation and Structuring Across Systems
Set up proactive alerts without moving your data
The technical buyer reading this is probably thinking: connecting and monitoring across sources sounds like it requires data consolidation. A warehouse project. An ETL pipeline. Months of work before you see anything.
It doesn't.
Each model connects to its source independently and reads data in place. No data movement. No replication. No unified warehouse required. The correlation happens at the insight layer, not the data layer. Insights get connected. Data stays where it is.
Security carries through from your source systems. Row-level and column-level security, enforced before the query runs, not filtered after. The compliance use case above shows what that looks like in practice.
Deployment is flexible: multi-tenant SaaS, single-tenant, hybrid, on-prem, air-gapped, and edge. Data never leaves your environment. That's architectural, not a configuration option.
Cross-source alerts are one part of the broader proactive monitoring approach. For situations where you need to compare values within a single data source rather than combine data across sources, comparative alerts handle that.
Does proactive monitoring across sources apply to you?
Three signals that cross-source alerts fit your environment: your operational data lives in more than one system, your team currently correlates signals across those systems manually, and delayed insight has a real cost, whether that's lost revenue, compliance exposure, or operational escalation.
Chata.ai connects to structured databases, warehouses, and APIs using standard drivers and protocols. If your data is queryable, it's connectable.
More Updates