Topics

Help teams explore data without compromising privacy.
Help teams explore data without compromising privacy.
Your Infrastructure Has Proactive Monitoring. Your Business Data Doesn't.
Published
8 min read
Topics:
Proactive Alerts
Table of Contents
Your infrastructure team already has proactive monitoring. When a server goes down, they know. If latency spikes past a threshold, someone gets paged before customers notice. That problem is solved. Entire product categories exist for it.
Now think about the data those systems produce. Revenue by region. Transaction volumes by product line. Cost variances that should trigger a review but don’t because nobody asked. These numbers live in databases across your organization. They get looked at when someone pulls a report or opens a dashboard. Between those moments, nothing is watching.
Dashboards are good at showing you what you asked to see, when you look. The gap is everything that happens between checks. There’s no continuous data monitoring running against the numbers that actually drive the business. A pattern starts forming on Tuesday. If nobody pulls the right report until Friday, three days of signal sat in a database doing nothing. Multiply that across every operational data source in the organization, and the question stops being whether things get missed. It’s how much.
Why This Hasn’t Crossed Over from Infrastructure
Infrastructure monitoring works because everything flows into one platform. Logs, metrics, traces, all centralized, all watched continuously. For business data spread across operational databases, the equivalent would be consolidating every source into a warehouse with synchronized ETL pipelines. That’s a 6 to 18 month project before any automated monitoring starts. Most teams start it. Few finish.
Consolidating everything was never the actual goal. The goal is knowing when something changes in your data that needs attention, without someone having to remember to go look. You don’t need every source in one place to do that. You need every source watched.
Proactive monitoring without moving the data
Instead of moving data into one system, you put a dedicated custom model on each data source. Each one connects independently, reads its source natively, and watches for the conditions you define: thresholds, anomaly detection, trends, deviations from expected patterns.
The easiest way to understand it is to see how it gets used.
Take a multi-property casino operator running hundreds of slot machines across several locations. Every machine generates daily meter data: net win, theoretical win, actual hold, hold variance, coin-in, broken out by game theme, manufacturer, and denomination. Today, someone pulls a report, scrolls through it, and investigates anything that looks off. Across hundreds of machines, things slip through.
With proactive monitoring, the slot director types a question the way they’d ask it out loud: “Show me actual hold vs. theoretical hold by game theme at our Vegas property, only themes with more than two machines, sorted by the biggest gap, last 12 months.” The system translates that into a precise query against the actual data. No SQL. No report request submitted to the data team. The model is trained on that organization’s schema, metrics, and terminology, so “actual hold,” “theoretical hold,” and “Las Vegas” mean exactly what they mean in that business, not a generic approximation. The database returns the answer. Turn that question into a standing monitor through alerting: the slot director sets it up once, and the system re-runs it automatically against each new day's data, watching for the same condition to recur. When the condition is met, it surfaces. When it's not, silence.
Both filters matter. Hold variance alone surfaces noise. A game nobody plays can show wild variance because the sample size is too small. Pairing it with a volume floor means the system only flags games where real money is moving through and the math isn’t lining up. High variance on a low-volume game is a statistical artifact. High variance on a high-volume game is revenue walking out the door.
This is where proactive monitoring differs from basic threshold alerting. A threshold alert fires every time a number crosses a line. That’s how you end up with 200 notifications and no idea which ones matter. Here, the monitoring conditions are built to filter out the noise before it reaches anyone. If the data doesn’t support the signal, it doesn’t fire.
The same operator can set a second monitor: flag any machine running net-negative on an average day, broken out by manufacturer and game theme. At one property, this surfaced over 100 machines totaling more than $200,000 in monthly losses. But the list isn’t the point. The value is what happens next. When the same game theme runs across multiple properties, the cross-property comparison becomes the diagnostic. If hold variance is high everywhere, it’s probably the game. If it’s only high at one location, the issue is local: floor position, player mix, machine condition. That distinction changes whether you call the manufacturer or move the machine.
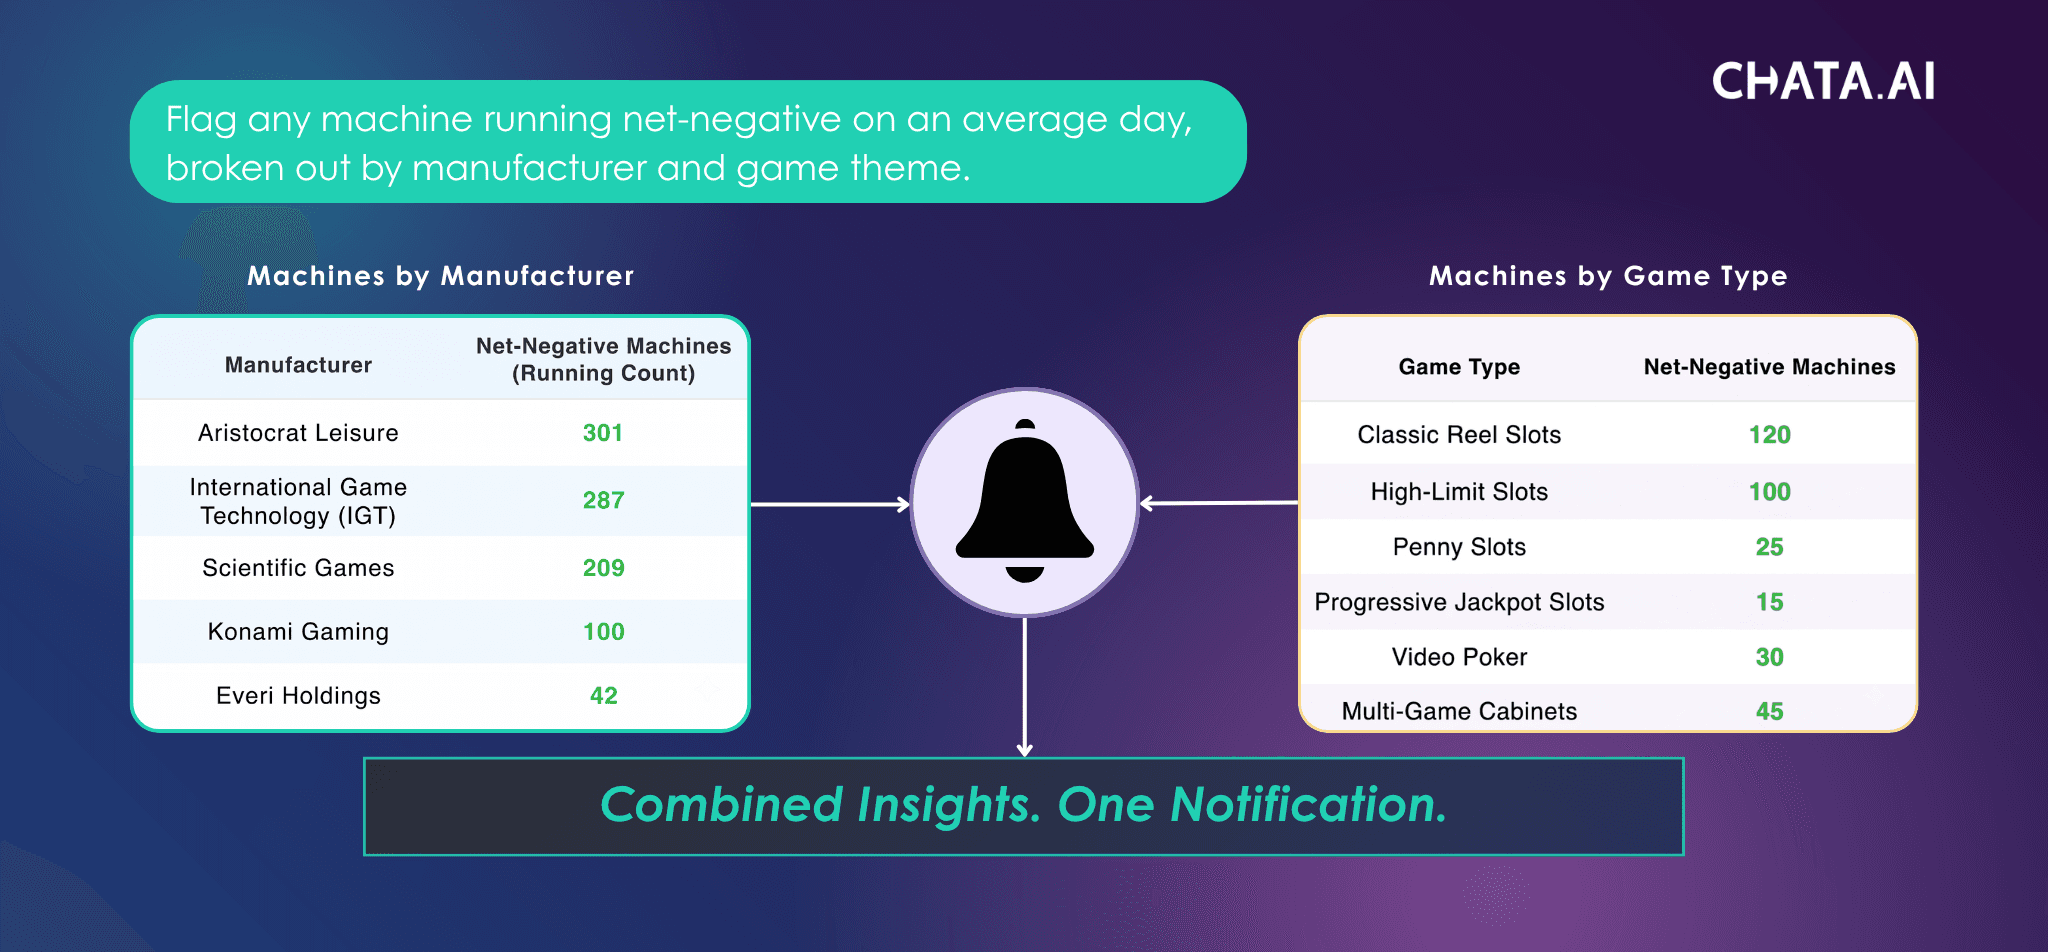
None of this required merging data across properties into a single warehouse. Each source is read independently. The insights get connected. The data stays where it is.
For cross-source data monitoring, where conditions span separate systems, or multiple datasets within the same system, that’s handled through composite alerts. For comparisons within a single system, that’s a comparative alert. Both work without moving data.
Where the insights land matters as much as what they contain. If the notification ends up in a system nobody checks, it’s no better than the dashboard it replaced. Alerts can be delivered through Microsoft Teams, embedded directly into the applications teams already use, or accessed through an API. The point is that insights show up where work is already happening, not in a separate tool someone has to remember to open.

Proactive Monitoring At Scale: 500,000 Verified Insights
The Canton Network is a regulated financial infrastructure with institutional participants including Goldman Sachs and BNP Paribas. Transaction volumes, validator rewards, and fee behavior each lived in a separate system. Users with technical expertise were extracting and analyzing data directly from the backend, then manually correlating across sources when something looked off.
Continuous automated monitoring replaced it across every source. When transaction volume spikes while a validator shows validator rewards decline and fee behavior shifts, a real-time alert arrives with all three signals correlated, the specific data points behind it, and enough context to act immediately. No one has to remember to check.
Over approximately 10 months, proactive monitoring on this architecture delivered over 500,000 automated verified insights. 24/7, across every connected source. 100% consistent, repeatable outputs. Every output traceable to the exact query that produced it, against the exact data that existed at that moment.
Chata.ai built and operates Sync Insights for the Canton Network. It’s been running in production, in a regulated environment, for nearly a year.
Does This Apply to Your Data?
This matters if your data team keeps fielding ad-hoc requests for information your business users can’t get to today. If you need monitoring that handles complex analysis or spans more than one data source. Or if you’ve been asked to consolidate data for AI or analytics and the project keeps growing before it delivers anything.
Chata.ai connects directly to structured databases, warehouses, and streaming data, cloud or on-prem, without requiring you to move data. Read-only schema access is all that’s needed to build the first model, deployed inside your environment.
Common Questions
What is proactive monitoring for business data? Proactive monitoring for business data means continuously watching operational databases for changes that need attention, without someone having to run a report or open a dashboard first. Instead of reacting after someone notices a problem, the system watches 24/7 for thresholds, anomalies, and trends across your data sources, and surfaces what matters before it becomes a bigger issue. Infrastructure teams have had this for servers and applications for years. Proactive monitoring applies the same principle to the revenue, operations, and transaction data that actually runs the business.
How is proactive monitoring different from dashboards and alerts? A dashboard shows you what you asked to see, when you look. A threshold alert fires every time a number crosses a line, which is how teams end up with hundreds of notifications and no way to tell which ones matter. Proactive monitoring is continuous and filtered. It watches for conditions you define, validates signals against the actual data before surfacing them, and connects related changes across sources into a single notification with context. The difference is that dashboards and basic alerts are reactive by design. They depend on someone checking at the right time or wading through noise to find what’s real. Proactive monitoring closes that gap.
Can Datadog or Splunk do proactive monitoring? Those watch infrastructure. Servers, applications, network health. They’re not designed to monitor business data sitting in operational databases. Different architecture, different problem.
What about AI hallucination? The AI generates the query. The database returns the result. That separation is what makes hallucination architecturally impossible, not unlikely. The system cannot produce an answer the data doesn't support. When it can't answer, it says so.
What about data security? Row-level and column-level security is inherited from the source system and enforced before the query runs, not filtered after. The query itself is built around the user’s identity and permissions. If you’re not authorized to see it, the query never asks for it.
Topics
Help teams explore data without compromising privacy.
Your Infrastructure Has Proactive Monitoring. Your Business Data Doesn't.
Published
8 min read
Topics:
Proactive Alerts
Table of Contents
Your infrastructure team already has proactive monitoring. When a server goes down, they know. If latency spikes past a threshold, someone gets paged before customers notice. That problem is solved. Entire product categories exist for it.
Now think about the data those systems produce. Revenue by region. Transaction volumes by product line. Cost variances that should trigger a review but don’t because nobody asked. These numbers live in databases across your organization. They get looked at when someone pulls a report or opens a dashboard. Between those moments, nothing is watching.
Dashboards are good at showing you what you asked to see, when you look. The gap is everything that happens between checks. There’s no continuous data monitoring running against the numbers that actually drive the business. A pattern starts forming on Tuesday. If nobody pulls the right report until Friday, three days of signal sat in a database doing nothing. Multiply that across every operational data source in the organization, and the question stops being whether things get missed. It’s how much.
Why This Hasn’t Crossed Over from Infrastructure
Infrastructure monitoring works because everything flows into one platform. Logs, metrics, traces, all centralized, all watched continuously. For business data spread across operational databases, the equivalent would be consolidating every source into a warehouse with synchronized ETL pipelines. That’s a 6 to 18 month project before any automated monitoring starts. Most teams start it. Few finish.
Consolidating everything was never the actual goal. The goal is knowing when something changes in your data that needs attention, without someone having to remember to go look. You don’t need every source in one place to do that. You need every source watched.
Proactive monitoring without moving the data
Instead of moving data into one system, you put a dedicated custom model on each data source. Each one connects independently, reads its source natively, and watches for the conditions you define: thresholds, anomaly detection, trends, deviations from expected patterns.
The easiest way to understand it is to see how it gets used.
Take a multi-property casino operator running hundreds of slot machines across several locations. Every machine generates daily meter data: net win, theoretical win, actual hold, hold variance, coin-in, broken out by game theme, manufacturer, and denomination. Today, someone pulls a report, scrolls through it, and investigates anything that looks off. Across hundreds of machines, things slip through.
With proactive monitoring, the slot director types a question the way they’d ask it out loud: “Show me actual hold vs. theoretical hold by game theme at our Vegas property, only themes with more than two machines, sorted by the biggest gap, last 12 months.” The system translates that into a precise query against the actual data. No SQL. No report request submitted to the data team. The model is trained on that organization’s schema, metrics, and terminology, so “actual hold,” “theoretical hold,” and “Las Vegas” mean exactly what they mean in that business, not a generic approximation. The database returns the answer. Turn that question into a standing monitor through alerting: the slot director sets it up once, and the system re-runs it automatically against each new day's data, watching for the same condition to recur. When the condition is met, it surfaces. When it's not, silence.
Both filters matter. Hold variance alone surfaces noise. A game nobody plays can show wild variance because the sample size is too small. Pairing it with a volume floor means the system only flags games where real money is moving through and the math isn’t lining up. High variance on a low-volume game is a statistical artifact. High variance on a high-volume game is revenue walking out the door.
This is where proactive monitoring differs from basic threshold alerting. A threshold alert fires every time a number crosses a line. That’s how you end up with 200 notifications and no idea which ones matter. Here, the monitoring conditions are built to filter out the noise before it reaches anyone. If the data doesn’t support the signal, it doesn’t fire.
The same operator can set a second monitor: flag any machine running net-negative on an average day, broken out by manufacturer and game theme. At one property, this surfaced over 100 machines totaling more than $200,000 in monthly losses. But the list isn’t the point. The value is what happens next. When the same game theme runs across multiple properties, the cross-property comparison becomes the diagnostic. If hold variance is high everywhere, it’s probably the game. If it’s only high at one location, the issue is local: floor position, player mix, machine condition. That distinction changes whether you call the manufacturer or move the machine.
None of this required merging data across properties into a single warehouse. Each source is read independently. The insights get connected. The data stays where it is.
For cross-source data monitoring, where conditions span separate systems, or multiple datasets within the same system, that’s handled through composite alerts. For comparisons within a single system, that’s a comparative alert. Both work without moving data.
Where the insights land matters as much as what they contain. If the notification ends up in a system nobody checks, it’s no better than the dashboard it replaced. Alerts can be delivered through Microsoft Teams, embedded directly into the applications teams already use, or accessed through an API. The point is that insights show up where work is already happening, not in a separate tool someone has to remember to open.
Proactive Monitoring At Scale: 500,000 Verified Insights
The Canton Network is a regulated financial infrastructure with institutional participants including Goldman Sachs and BNP Paribas. Transaction volumes, validator rewards, and fee behavior each lived in a separate system. Users with technical expertise were extracting and analyzing data directly from the backend, then manually correlating across sources when something looked off.
Continuous automated monitoring replaced it across every source. When transaction volume spikes while a validator shows validator rewards decline and fee behavior shifts, a real-time alert arrives with all three signals correlated, the specific data points behind it, and enough context to act immediately. No one has to remember to check.
Over approximately 10 months, proactive monitoring on this architecture delivered over 500,000 automated verified insights. 24/7, across every connected source. 100% consistent, repeatable outputs. Every output traceable to the exact query that produced it, against the exact data that existed at that moment.
Chata.ai built and operates Sync Insights for the Canton Network. It’s been running in production, in a regulated environment, for nearly a year.
Does This Apply to Your Data?
This matters if your data team keeps fielding ad-hoc requests for information your business users can’t get to today. If you need monitoring that handles complex analysis or spans more than one data source. Or if you’ve been asked to consolidate data for AI or analytics and the project keeps growing before it delivers anything.
Chata.ai connects directly to structured databases, warehouses, and streaming data, cloud or on-prem, without requiring you to move data. Read-only schema access is all that’s needed to build the first model, deployed inside your environment.
Common Questions
What is proactive monitoring for business data? Proactive monitoring for business data means continuously watching operational databases for changes that need attention, without someone having to run a report or open a dashboard first. Instead of reacting after someone notices a problem, the system watches 24/7 for thresholds, anomalies, and trends across your data sources, and surfaces what matters before it becomes a bigger issue. Infrastructure teams have had this for servers and applications for years. Proactive monitoring applies the same principle to the revenue, operations, and transaction data that actually runs the business.
How is proactive monitoring different from dashboards and alerts? A dashboard shows you what you asked to see, when you look. A threshold alert fires every time a number crosses a line, which is how teams end up with hundreds of notifications and no way to tell which ones matter. Proactive monitoring is continuous and filtered. It watches for conditions you define, validates signals against the actual data before surfacing them, and connects related changes across sources into a single notification with context. The difference is that dashboards and basic alerts are reactive by design. They depend on someone checking at the right time or wading through noise to find what’s real. Proactive monitoring closes that gap.
Can Datadog or Splunk do proactive monitoring? Those watch infrastructure. Servers, applications, network health. They’re not designed to monitor business data sitting in operational databases. Different architecture, different problem.
What about AI hallucination? The AI generates the query. The database returns the result. That separation is what makes hallucination architecturally impossible, not unlikely. The system cannot produce an answer the data doesn't support. When it can't answer, it says so.
What about data security? Row-level and column-level security is inherited from the source system and enforced before the query runs, not filtered after. The query itself is built around the user’s identity and permissions. If you’re not authorized to see it, the query never asks for it.
More Updates