
AutoQL for BI & Analytics Power Users.
~3 minute read
An organization’s key decision makers need accurate, real-time data to help them create powerful strategies that drive revenue and help them reach their goals. They rely on Business Intelligence (BI) systems with comprehensive dashboards or other reporting tools to keep a pulse on KPIs on an ongoing basis. This allows them to observe trends and discover insights at-a-glance, whenever they need.
However, the content displayed in a dashboard is often templated or customized by the provider rather than the user, only showcasing certain KPIs, high-level data points, or certain visualization types.
While these dashboards may be helpful when everything is “business as usual” for the user, this rigidity becomes problematic when anomalies in the data arise, when key information isn’t readily available in the templated dashboard, or when the data that is displayed provokes additional questions that the dashboard does not readily provide answers to.
Read more: Democratizing Data Access Across All Levels of an Organization
With a solution like AutoQL, it’s easy for BI providers to embed a user-friendly conversational user interface (UI) alongside a dashboard, so that users can seamlessly access additional data details and understand their data stories more holistically through powerful visualizations that make sense to them.
With Data Messenger, you can offer users immediate access to more data via an embedded conversational UI within the dashboard interface you already build.
Leveraging a conversational UI like Data Messenger, users don’t have to navigate to different dashboards or request ad hoc reports from other team members, they can just ask for the data details they need in their own words and get answers immediately.
This functionality improves user experience and increases both the value and usage of dashboarding features. Great dashboards already offer valuable insights, but meaningful insights also prompt data-driven users to explore different aspects of their data more deeply to connect the dots and analyze those cause and effect relationships.
Conversational UIs that facilitate access to data make this kind of exploration and analysis simple for users and scalable for providers.
For example, a sales manager checks their product sales dashboard first thing every morning. This dashboard was made available to the sales manager through the out-of-the-box reporting that was built into the tool their company has chosen. The dashboard shows a high-level overview of customer data, the status of product inventory, as well as general revenue trends. Information pertaining to the success of the manager’s sales team is hosted on a separate dashboard, alongside a range of other performance KPIs.
In looking at their sales dashboard, the manager wants to know which sales team members have been selling the highest volume of products and the average number of sales that each sales rep makes each month, so they can get a better idea of who is responsible for driving recent growth and have those reps share their insights about successful tactics and strategies in their upcoming monthly sales meeting.
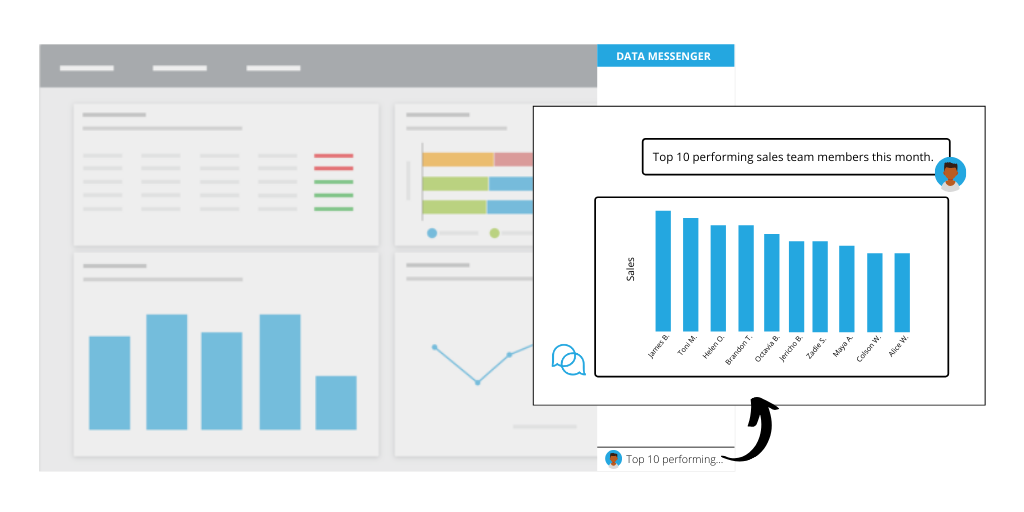
The manager can use a conversational interface like Data Messenger to ask “Top 10 performing sales team members this month” or “Who sold the most X this month?” without having to navigate to the team performance dashboard to find this information.
Read more: Elevating Out-of-Office Mobile Data Access
In another scenario, this information may not be readily available in a separate dashboard at all, and the sales manager would have to request a custom report to view this specific data. A conversational user interface backed by conversational AI can solve both of these restrictive circumstances.
In this case, the sales manager finds that their regular workflows are made more efficient and more intuitive. Subsequently, they opt to access and leverage their data directly through their software on a more regular basis. They find more value in the BI and analytics tools they’re using because the tool itself is equipped to help them do their job better, ultimately driving more growth and boosting performance through streamlined access to insights.